Introduction
AQuA Tools
Axiotl Inc. and the Gryder lab at Case Western Reserve University are developing AQuA tools to facilitate the analysis and visualization of increasingly complex 3D data.
The name ‘AQuA’ derives from Absolute QUantification of chromatin Architecture, an experimental design in which 3D contacts are counted from paired-end tags (PETs) from the human genome and are normalized to the total PETs from the mouse genome, enabling more quantitative insights into the topological determinants of biology in question. The publication can be found here:
Gryder, B.E., Khan, J. & Stanton, B.Z. Measurement of differential chromatin interactions with absolute quantification of architecture (AQuA-HiChIP). Nat Protoc 15, 1209–1236 (2020). https://doi.org/10.1038/s41596-019-0285-9
Units of operation
Here we describe three primary units of operation for working with AQuA Tools. You will encounter these units of operation as inputs and outputs for various tools.
sample 🔴
A “sample” refers to a single directory within a data directory inside a tinker box. The sample directory contains multiple 3D genomics files, including a .hic contact matrix file that can be visually represented as two triangles mirrored by a diagonal center line.

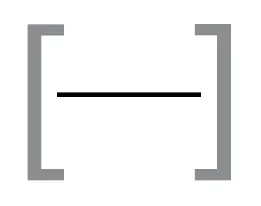
bed file 🔵
A BED file (Browser Extensible Data) is a text file used to describe genomic regions. It contains information about the chromosome, starting position, and ending position of genomic features, and can be visually represented by a single, horizontal line.
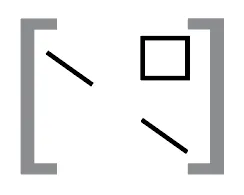
bedpe file 🟡
A BEDPE (Browser Extensible Data Paired-End) file defines the chromosome, start, and end positions for two genomic regions. BEDPE files are useful for understanding relationships between distinct genomic locations, and can be visually represented by two diagonal lines corresponding to a square region within a contact matrix.
Below is a color-coded table of various AQuA tools showing their input and operation types. Tools can be classified into “build”, “filter”, or “viz” groups depending on the functionality of the tool. If you are starting with a bed file, build_bedpe is likely to be the first tool in your pipeline. Once you have generated a bedpe file, you may move on to filter, query, and visualization tools.
| Tools | Inputs | Operations |
|---|---|---|
| build_bedpe | 🔵 | build |
| intersect_bedpe | 🟡 🔵 | filter |
| query_bedpe | 🟡 🔴 | query |
| summarize_interval | 🔵 🔴 | query |
| get_loops | 🔴 (🟡) | query |
| get_multisample_viewpoints | 🔴 | query |
| plot_APA | 🟡 🔴 | viz |
| plot_virtual_4C | 🔴 | viz |
| plot_contacts | 🔴 (🟡) | viz |
Research Pathways
The table below shows potential pathways for working with AQuA tools in a pipeline. Examples of these pathways can be found in the corresponding tutorials. To see all of the available tutorials, click here
| Pathway | Code Tutorial |
|---|---|
| build —> query | build_bedpe , query_bedpe |
| build —> viz | build_bedpe , plot_contacts |
| query —> viz | SOX8 , FOXO1/MYOG , SMARCA4 |
| build —> filter —> query | SOX8 , FOXO1/MYOG , SMARCA4 |
| build —> filter —> query —> viz | SOX8 , FOXO1/MYOG , SMARCA4 |