FOXO1, MYOG
Research questions
This task-based tutorial builds upon three previous tool-oriented tutorials build_bedpe, query_bedpe, and plot_contacts and also introduces an alternate solution using get_loops. Becoming familiar with these tools is recommended before diving into this tutorial. In this tutorial, we will explore two different approaches to answer the following questions:
- Which enhancers near the FOXO1 gene interact most frequently?
- Which enhancers near the MYOG gene interact most frequently?
FOXO1
To answer the first question, we will start by identifying the TAD where FOXO1 resides and obtaining all the H3K27ac peaks for the TAD using bedtools. Next, we will build genomic pairs between FOXO1 H3K27ac peaks with build_bedpe and determine contact frequencies of the pairings using query_bedpe. We will use plot_contacts to visualize the process and conclude with a visualization of the strongest enhancer loop near the FOXO1 gene.
To answer the second question, we will identify the enhancers that interact most frequently using the get_loops tool, and visualize the strongest interactions with plot_contacts. The goal of this tutorial is to demonstrate how to employ various tools to effectively analyze genomic interactions near specific genes.
Let’s start with the first question. To list all available sample data on the Tinker box, simply type the following command into the terminal window:
list_samplesFor ease, let’s assign variable names to our samples and reference files.
sample=RH4_DMSO_GSM3414981
TSS=~/lab-data/hg38/reference/gencode.TSS.200bp.hg38.bed
TAD=~/lab-data/hg38/reference/TAD_goldstandard_lift.hg38.bed
PEAKS=~/lab-data/hg38/reference/primer_refs/peaks.bed
# *NOTE: the peak file $PEAKS is for illustration purposes only*
Obtain TSS
Now that we have a TSS file ready, we can obtain the FOXO1 TSS
cat $TSS | grep FOXO1 > FOXO1_tss.bedObtain TAD
Using the FOXO1 TSS, we can fetch the TAD where it resides
bedtools intersect \
   -a FOXO1_tss.bed \
   -b $TAD \
   -wa -wb
   | cut -f 6-8 \
   > FOXO1_tad.bed

cat FOXO1_tad.bed

chr13  39745863  40770864
Obtain peaks
Now, let’s now obtain all the H3K27ac peaks housed within the FOXO1 TAD.
bedtools intersect \
   -a $PEAKS \
   -b FOXO1_tad.bed > FOXO1_peaks.bed
Visualize locus
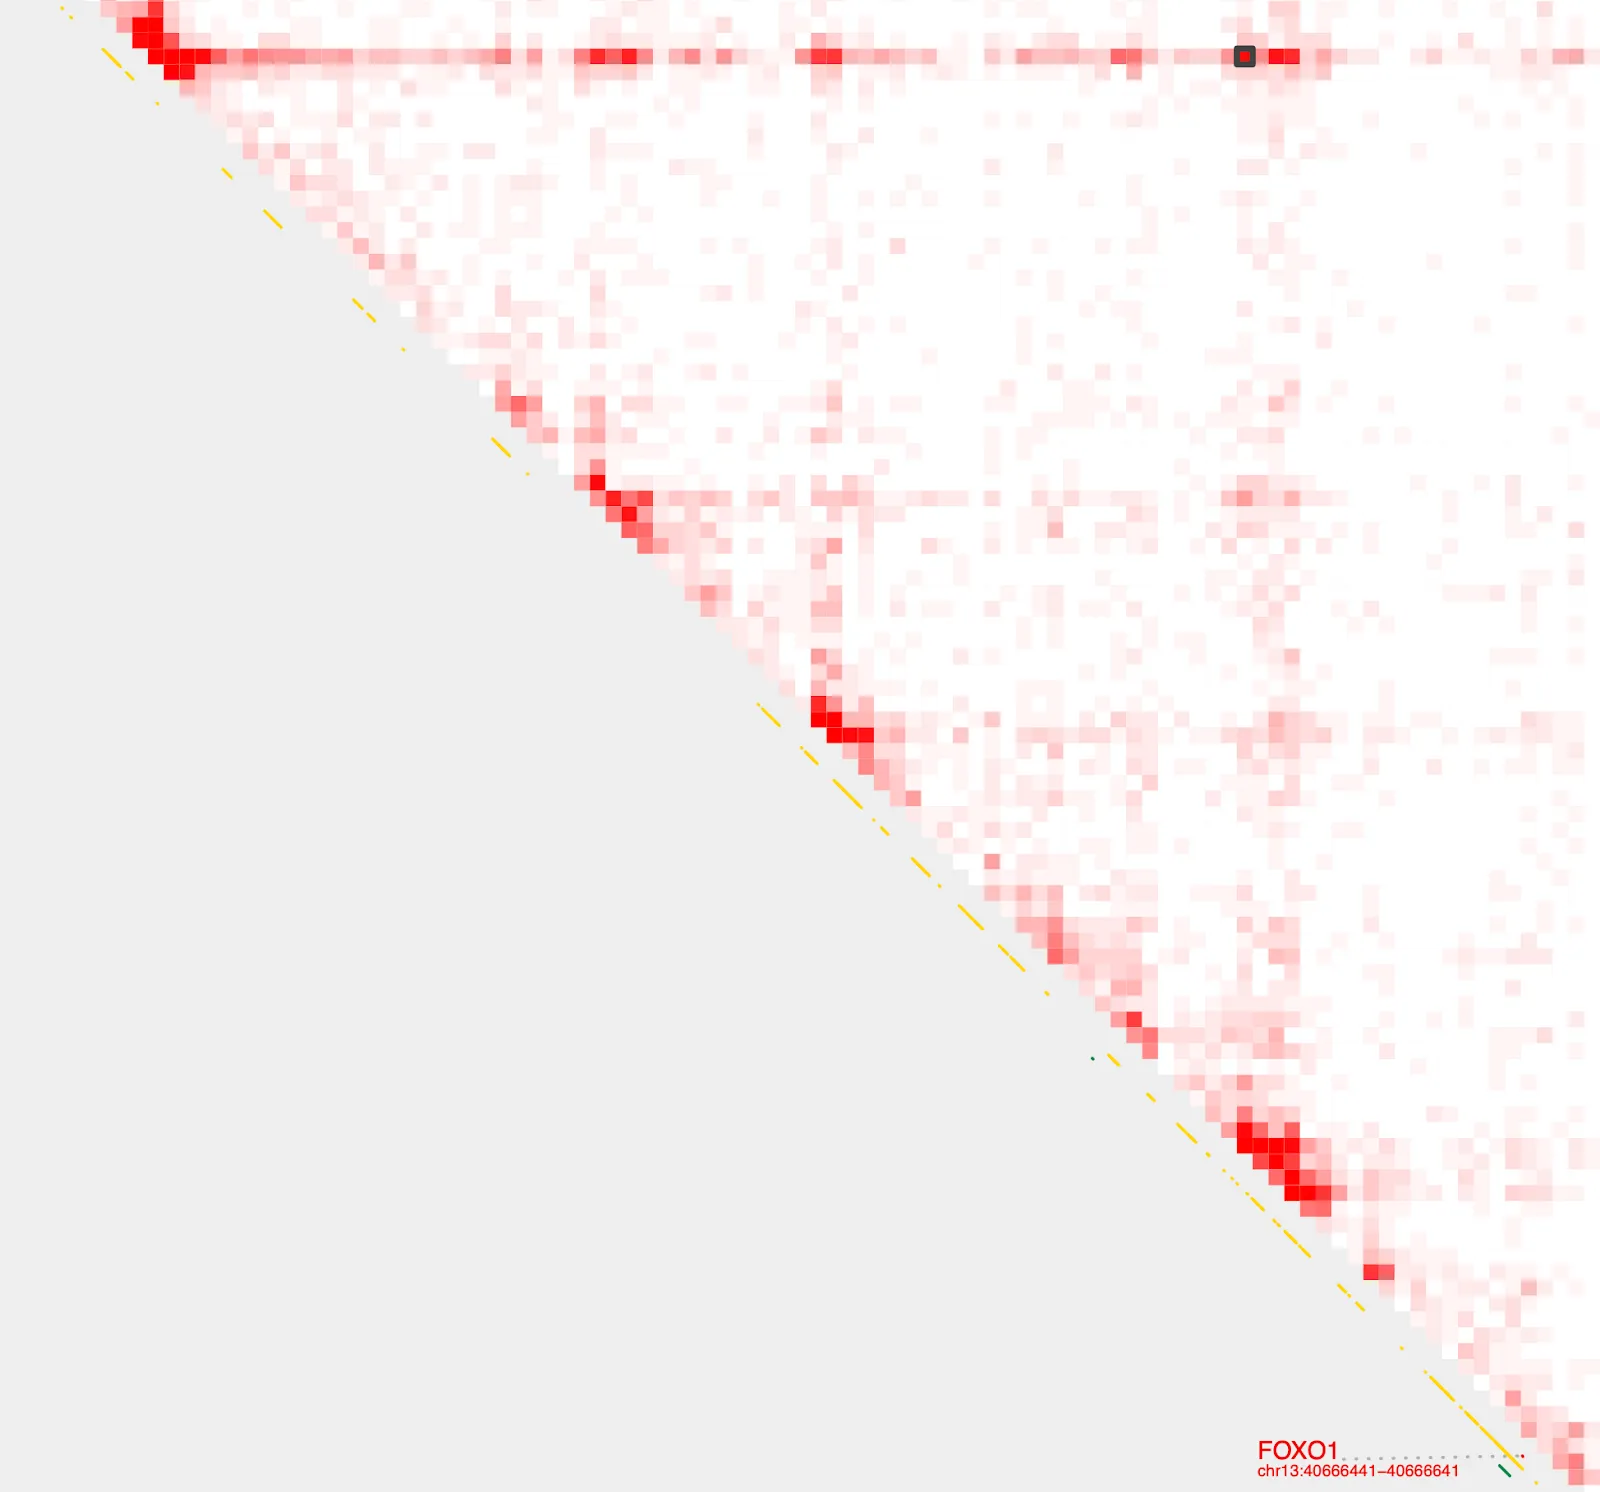
We can visualize the FOXO1 locus using plot_contacts.
plot_contacts \
   --sample1 $sample \
   --gene FOXO1 \
   --genome hg38 \
   --output_name FOXO1.pdf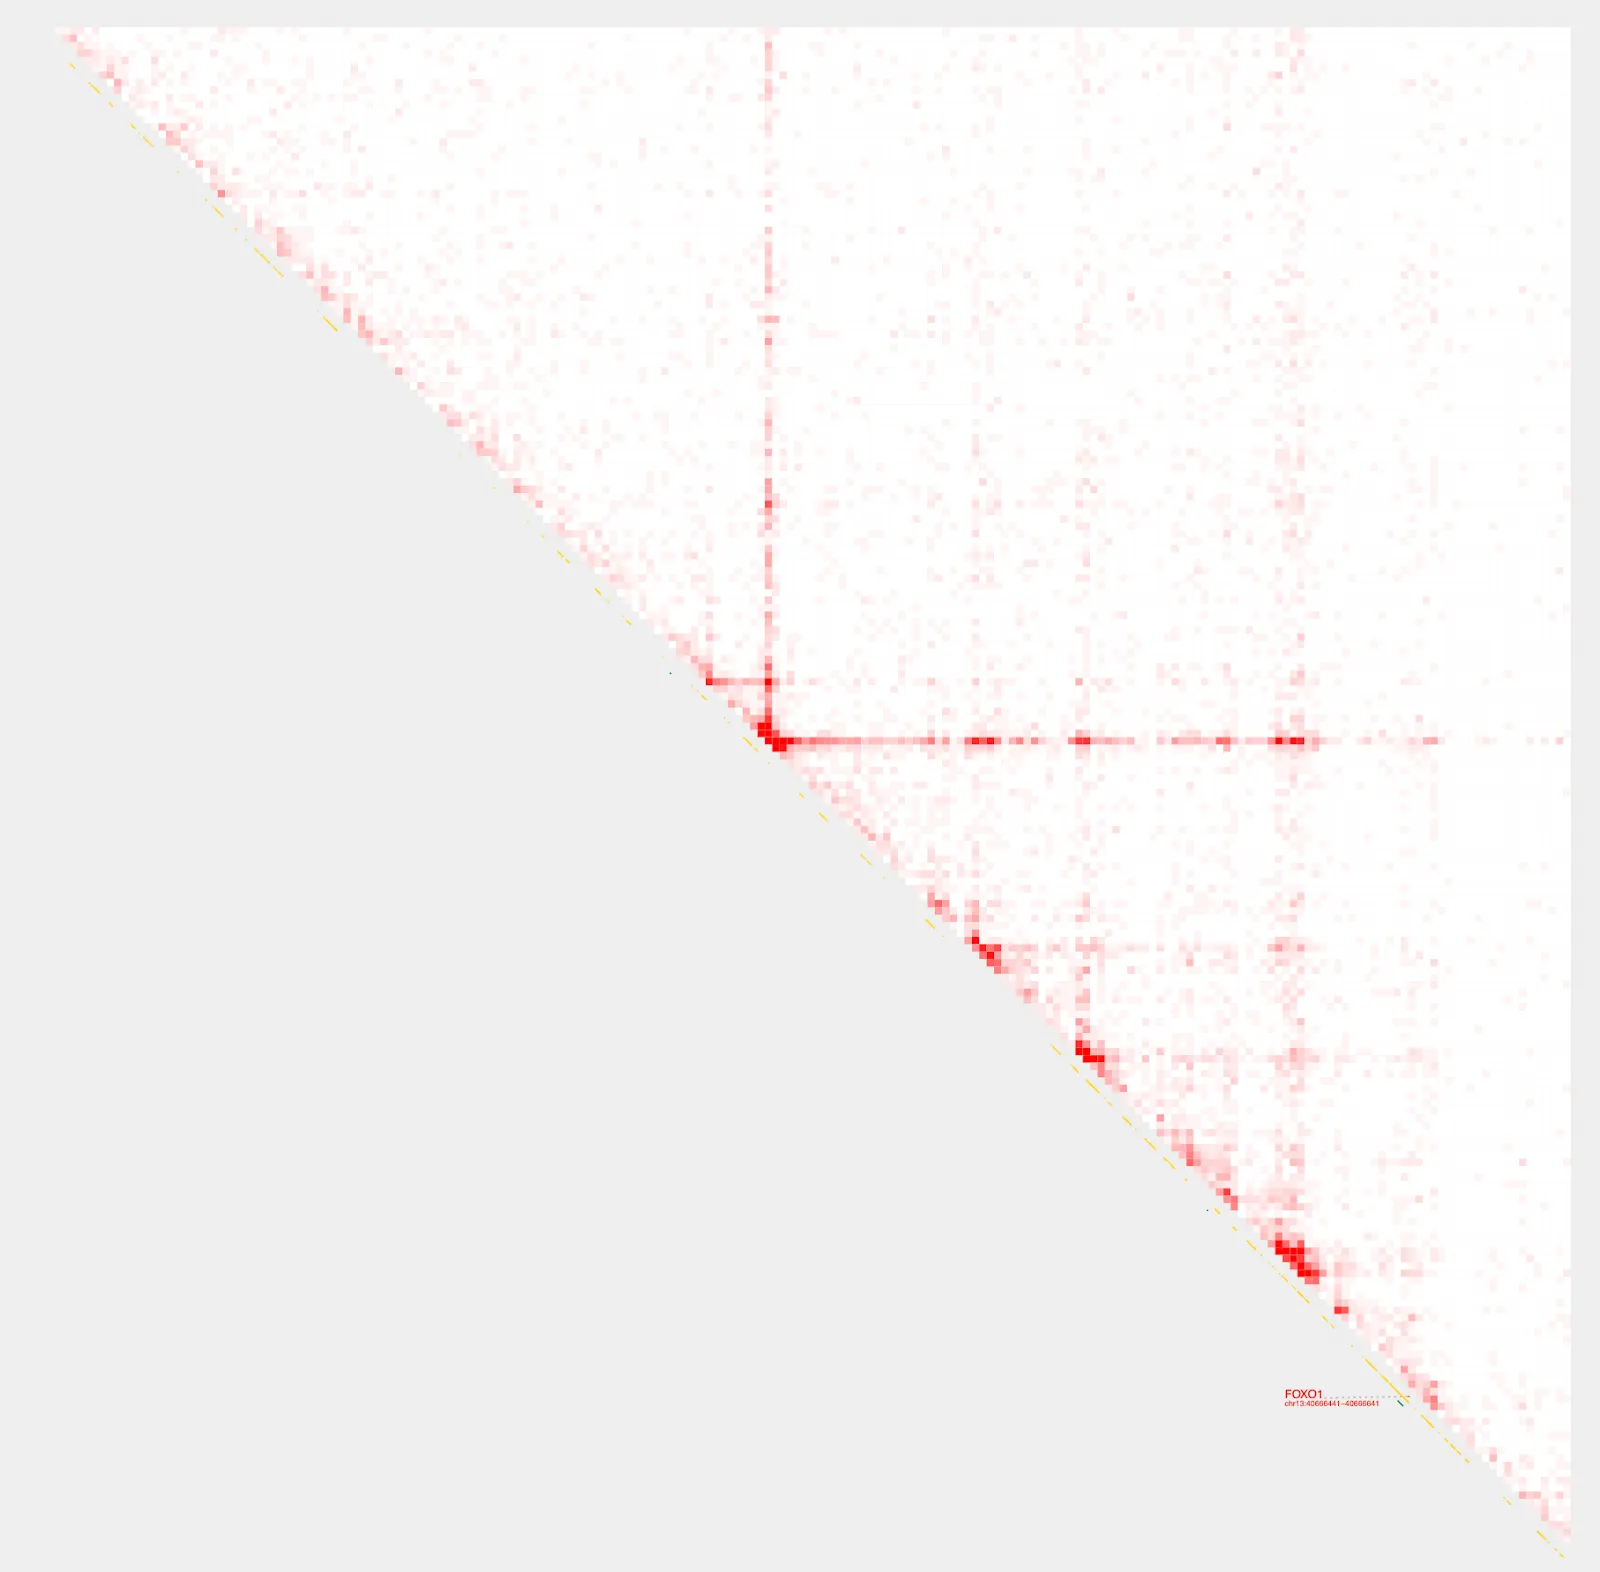
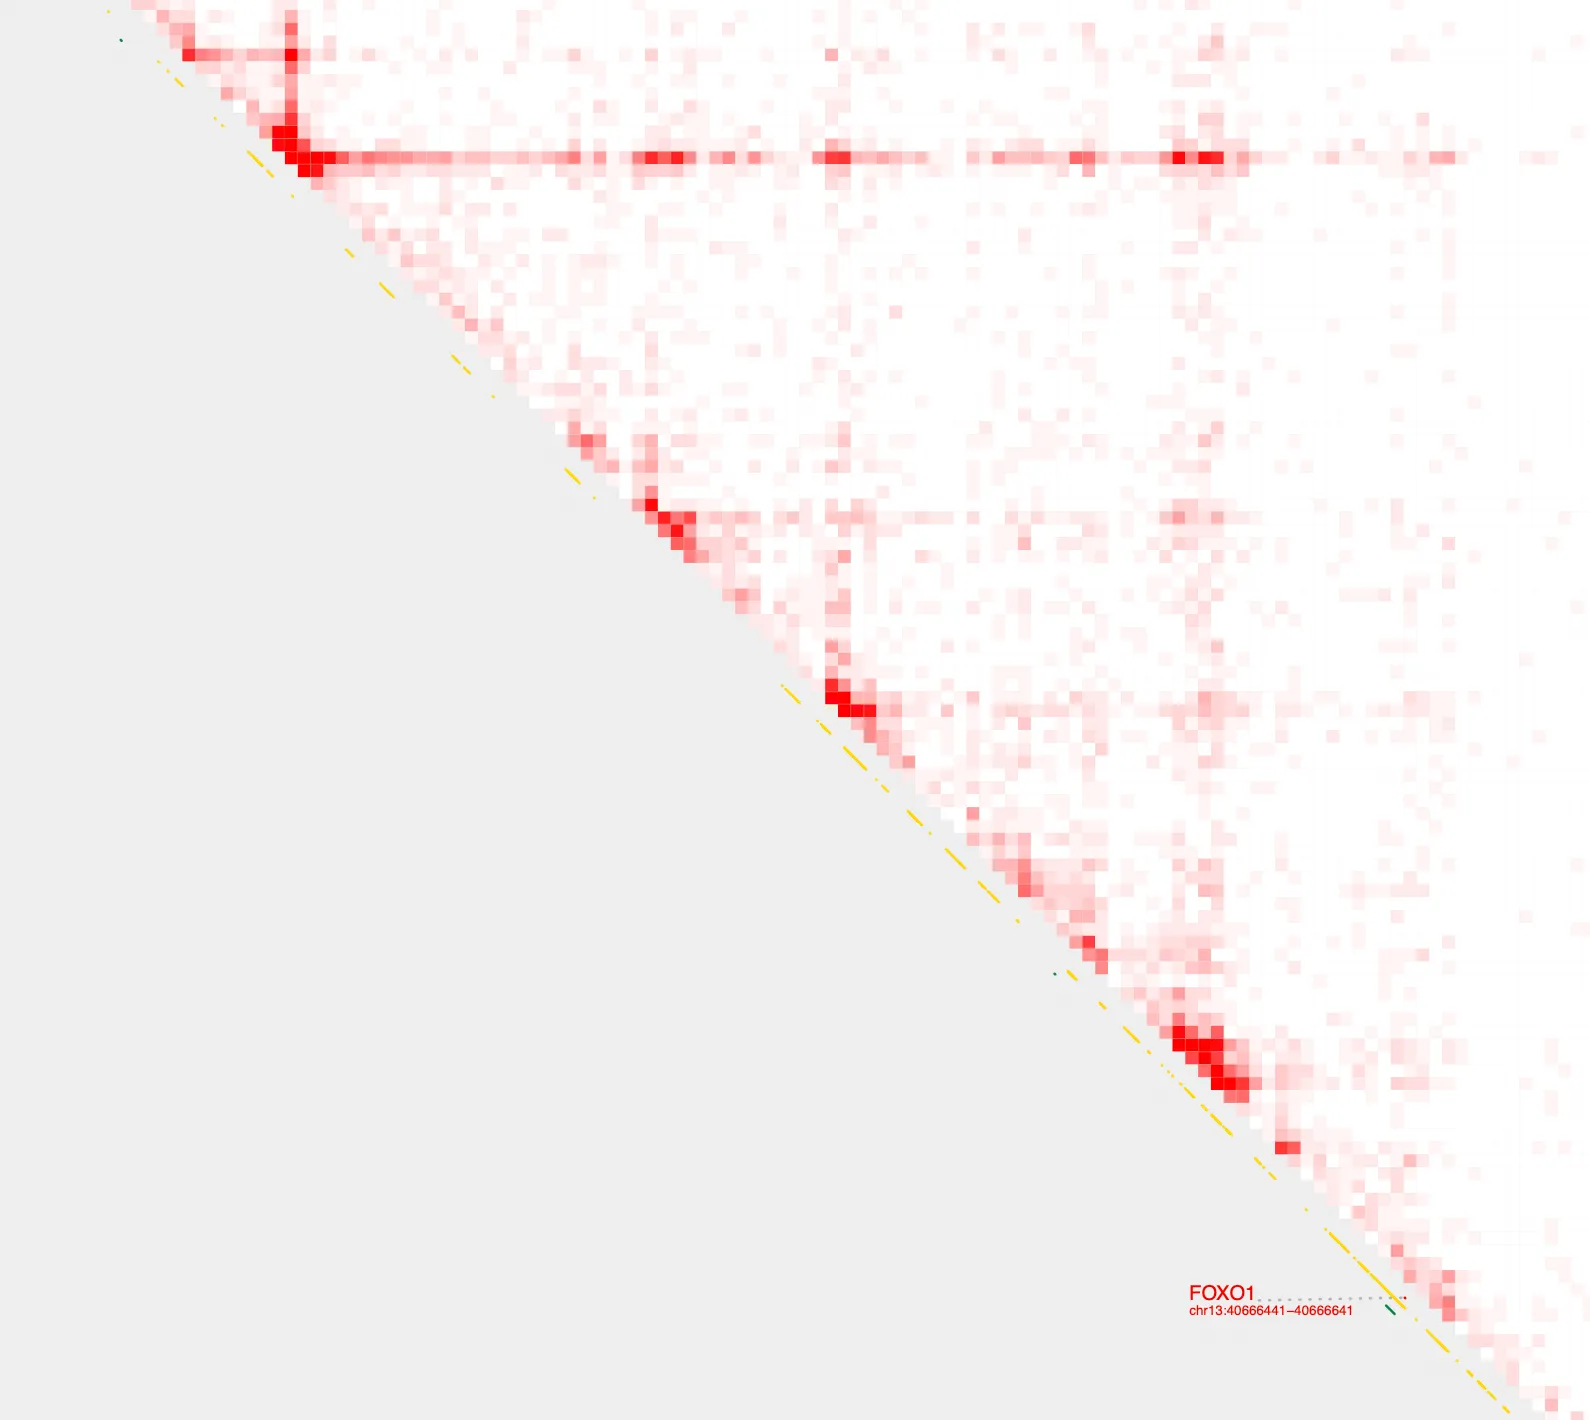
Zooming in..
Construct pairs
Using build_bedpe, we can now construct genomic pairings (as a bedpe file) between all FOXO1 H3K27ac peaks, and visualize them using the --bedpe option with plot_contacts
build_bedpe \
-A $PEAKS \
-B $PEAKS \
-d 20000 > FOXO1_peaks.bedpe
bedpe=FOXO1_peaks.bedpe

plot_contacts \
--sample1 $sample \
--gene FOXO1 \
--genome hg38 \
--output_name FOXO1_bedpe.pdf \
--bedpe $bedpe \
--bedpe_color 424242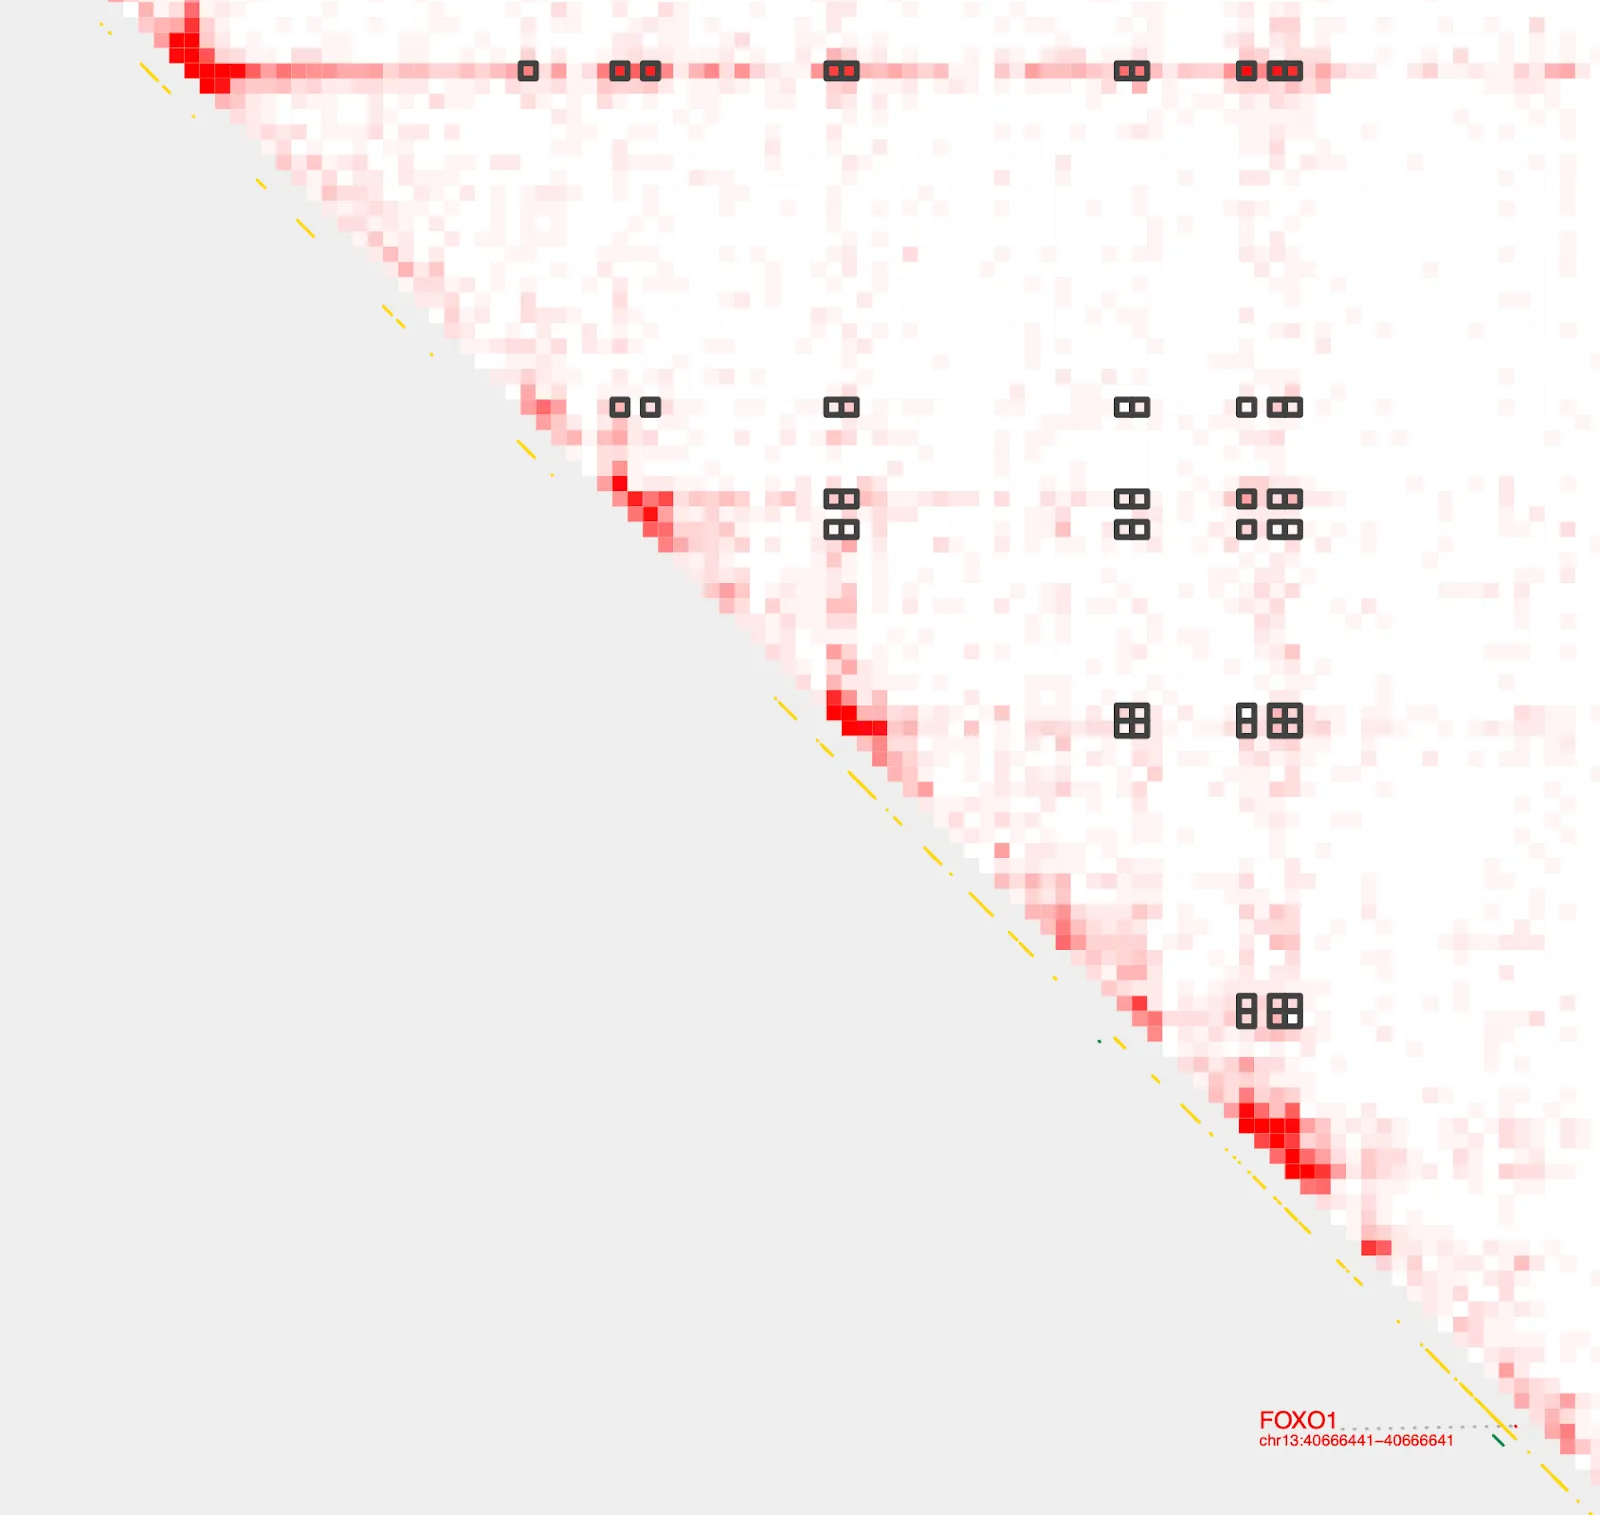
Query pairs
Great! We now have all the genomic pairings we want! We can now obtain the contact frequencies of these pairings using query_bedpe and sort them in increasing order
query_bedpe \
   --sample1 $sample
   --pair $bedpe \
   --genome hg38 | sort -k7n

chr13   40340001  40345000	chr13  40535001	40540000	0
chr13   40440001  40445000	chr13  40575001	40580000	0
chr13   40540001  40545000	chr13  40590001	40595000	0
chr13   40340001  40345000	chr13  40575001	40580000	0.186
chr13   40380001  40385000	chr13  40440001	40445000	0.186
...
chr13   40230001  40235000	chr13  40590001  40595000	3.724
chr13   40230001  40235000	chr13  40380001  40385000	3.91
chr13   40230001  40235000	chr13  40585001  40590000	4.096
chr13   40230001  40235000  chr13  40575001  40580000	4.282
Visualize strongest loop
The last entry with the highest contact value indicates the strongest loop. Let’s save that into a new file and visualize using the --gene and --bedpe options with with plot_contacts.
annotate_loops \
   --sample1 $sample \
   --pair $bedpe \
   --genome hg38 \
   | sort -k7n | tail -1 > FOXO1_loop.bedpe
plot_contacts \
--sample1 $sample \
--gene FOXO1 \
--genome hg38 \
--output_name FOXO1_loop.pdf \
--bedpe FOXO1_loop.bedpe \
--bedpe_color 424242There it is!
MYOG
Now, let’s look at Question 2.
Which enhancers near the MYOG gene interact most frequently?
We have an alternate way to answer this question using the tool get_loops. We’ll also use another sample to switch things up.
Visualize MYOG TAD
sample=RH41_K27ac

plot_contacts \
   --sample1 $sample \
   --gene MYOG \
   --genome hg38 \
   --output_name MYOG.pdf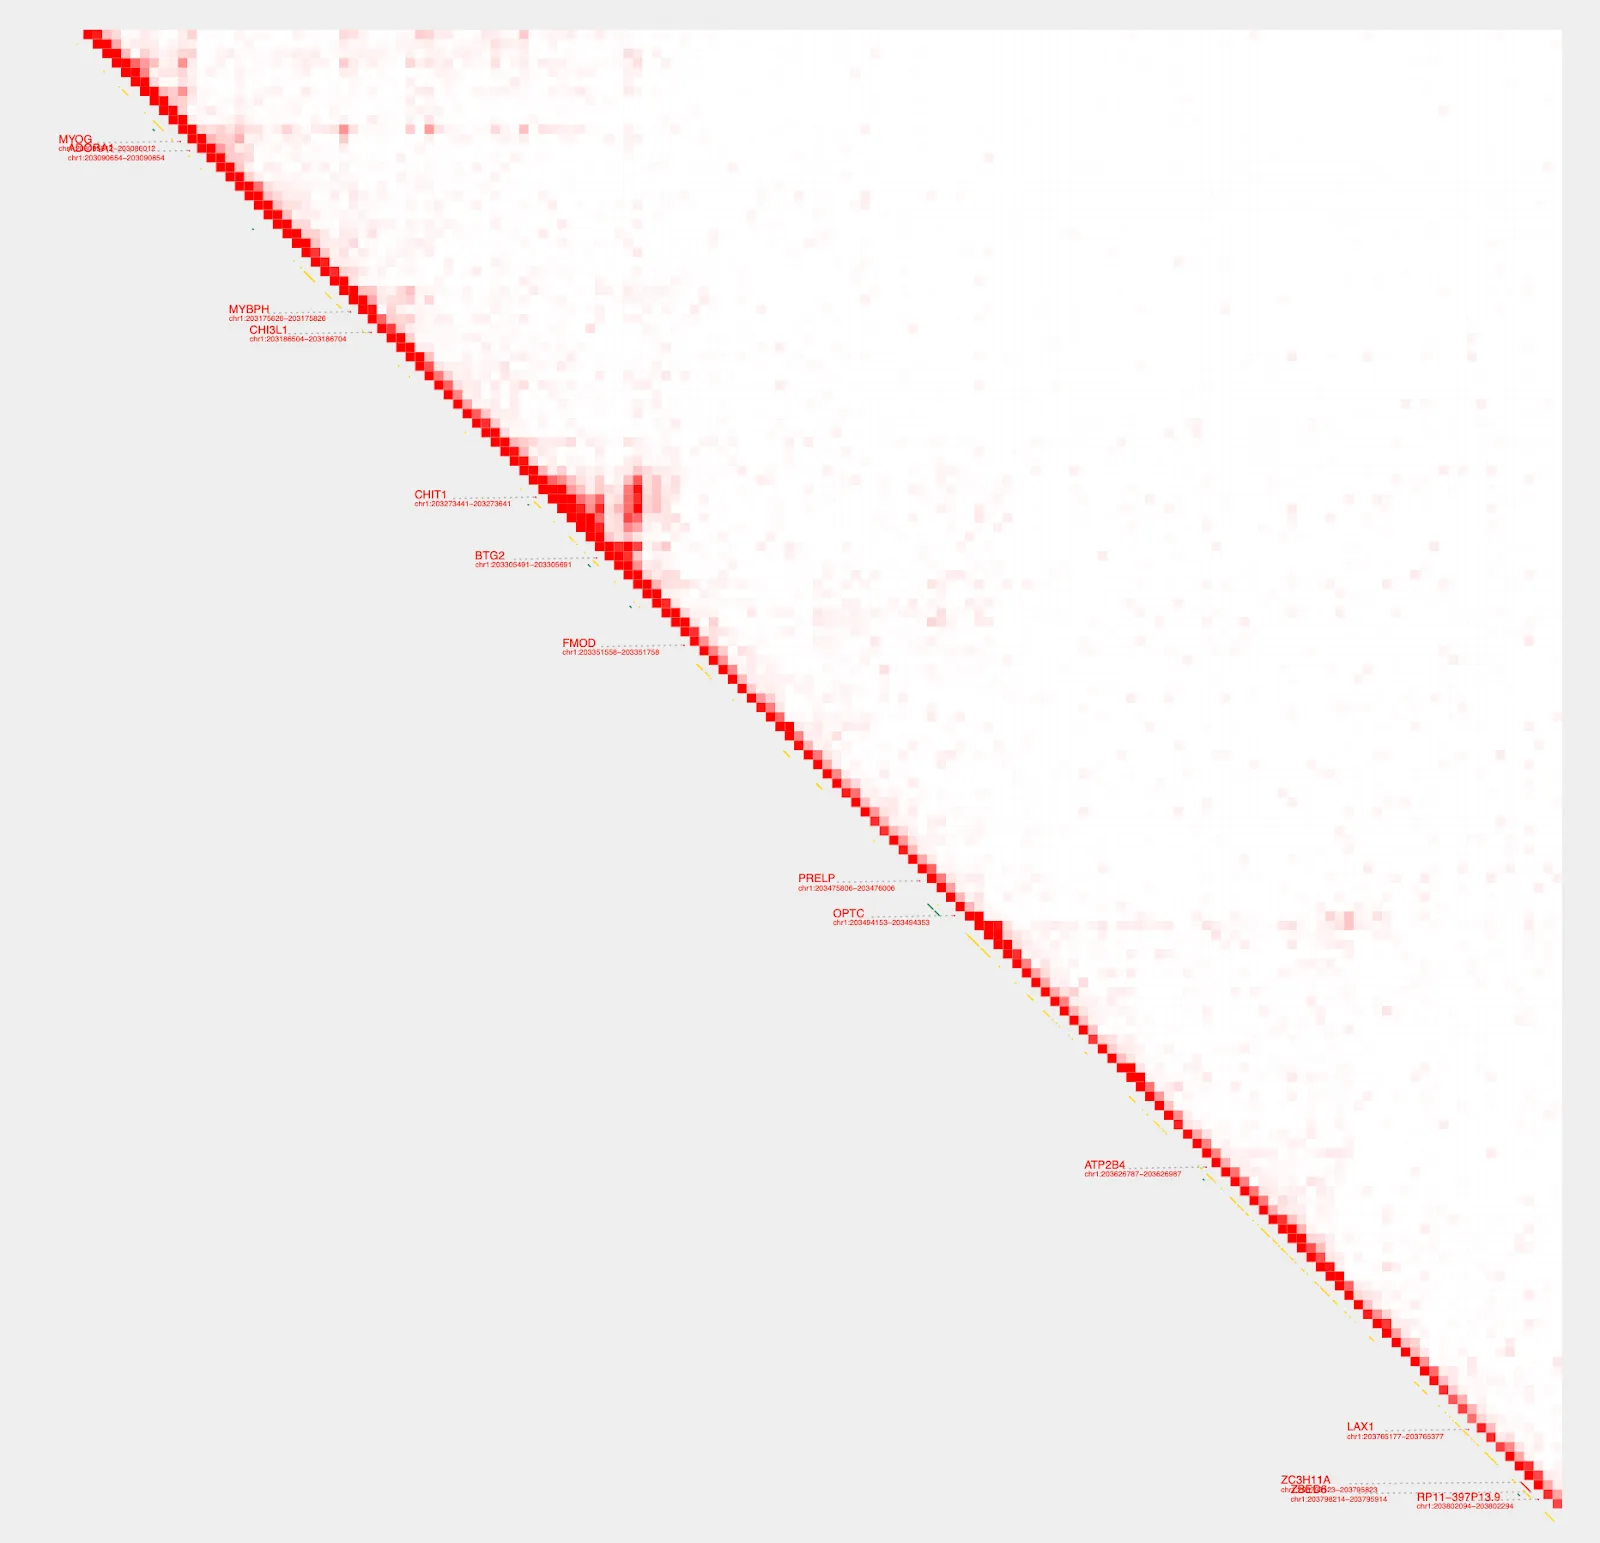
Hmmm, the diagonal is too dark. We can use --max_cap and focus on a shorter range to bring our color cap down and create better visualization. To do this, we’ll switch from using the gene parameter and instead define a specific range.
plot_contacts \
   --sample1 $sample \
   --range chr1:202800000:203500000:MYOG \
   --genome hg38 \
   --max_cap 1000 \
   --output_name MYOG_2.pdf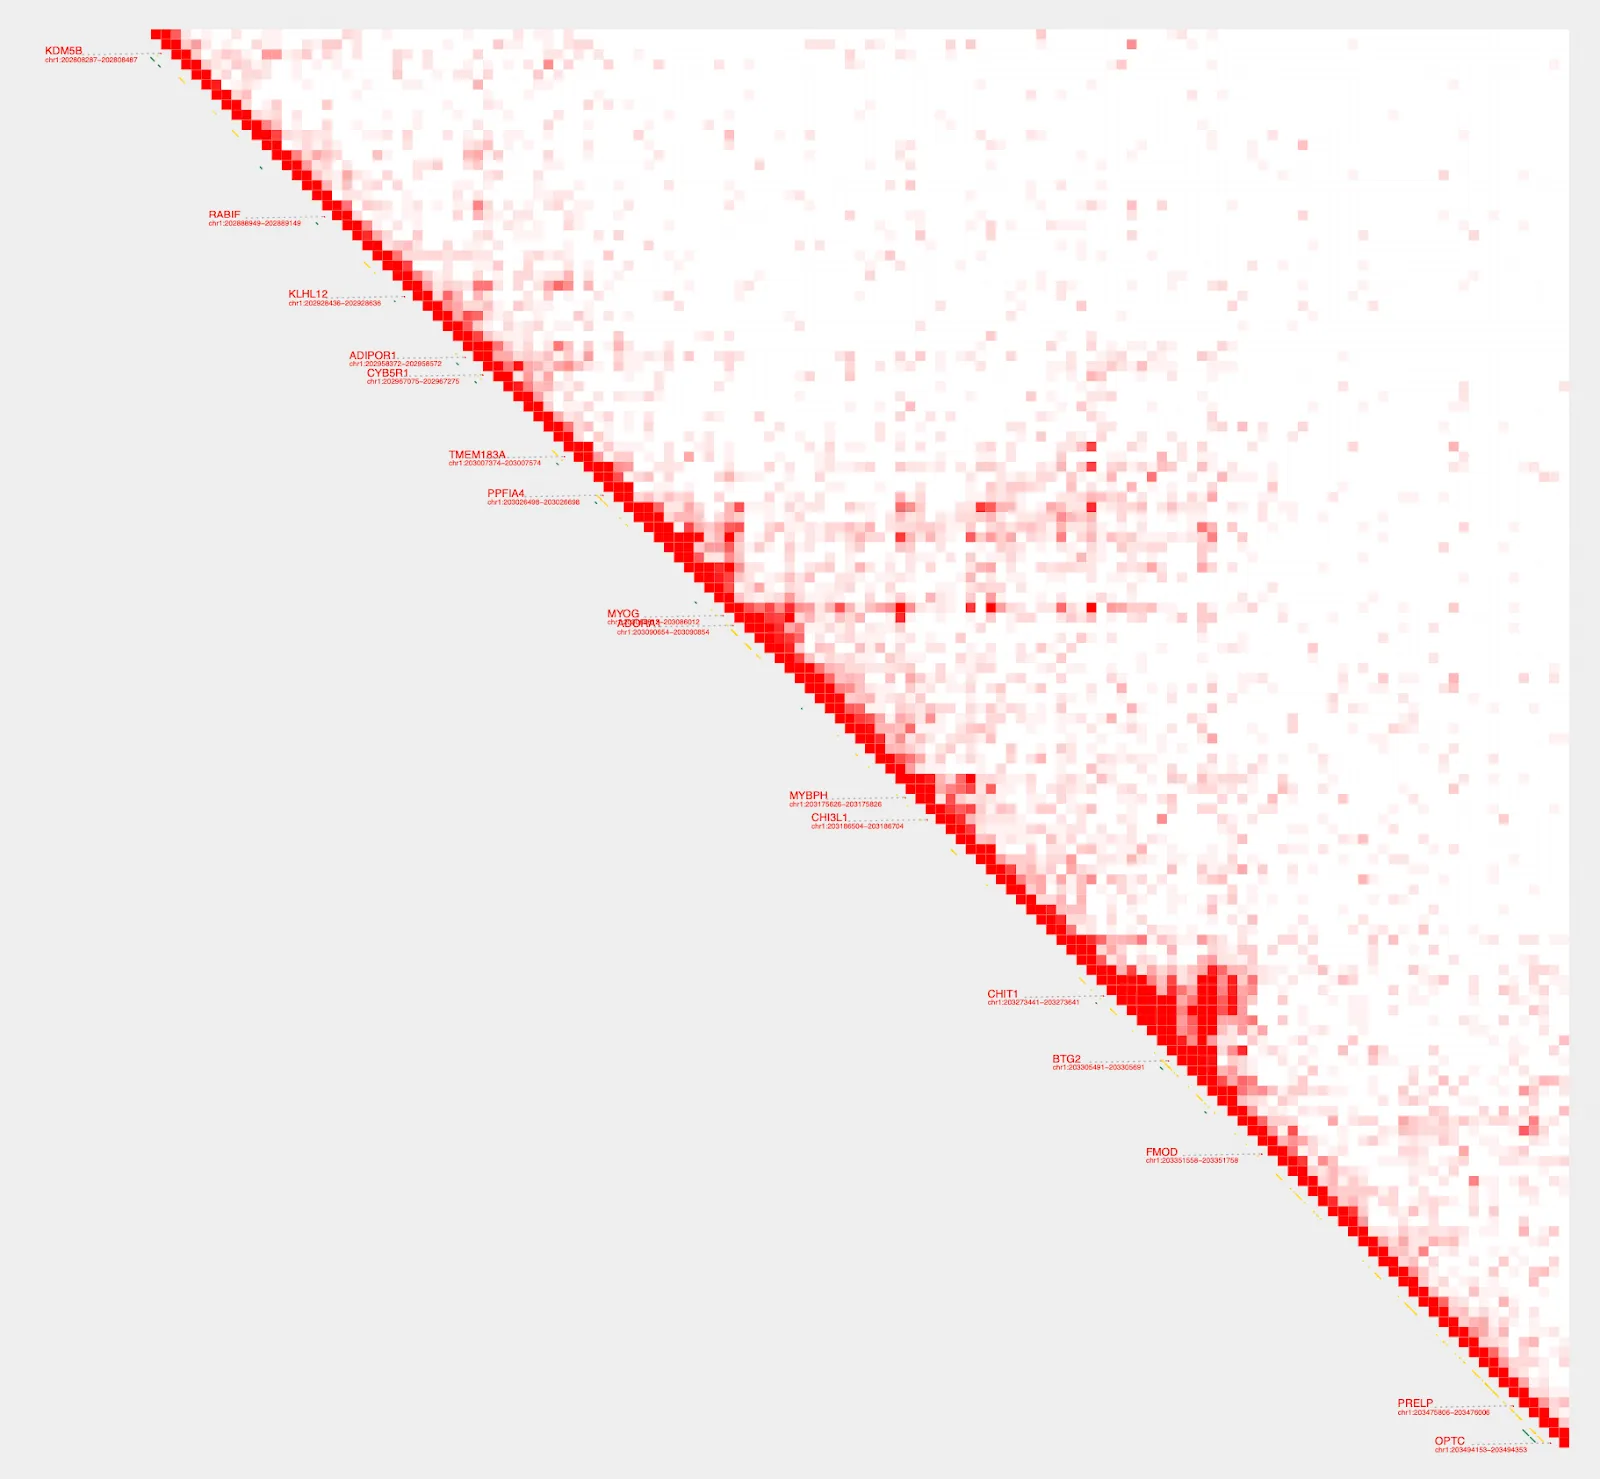
Get loops
Much better! Now, to get the enhancers that interact the most, we will use get_loops
get_loops \
   --sample_A $sample \
   --genome hg38 \
   --range chr1:202800000:203500000 | sort -k7n

chr1	203250000	203255000	chr1	203250000	203255000	1.003
chr1	202805000	202810000	chr1	203285000	203290000	1.015
chr1	203290000	203295000	chr1	203300000	203305000	1.022
...
chr1	203280000	203285000	chr1	203325000	203330000	4.301
chr1	203285000	203290000	chr1	203325000	203330000	4.944
chr1	203275000	203280000	chr1	203325000	203330000	5.227
All entries in this file indicate strong interactions, the last entry being the strongest. Let’s save all of them into a new file and visualize using plot_contacts.
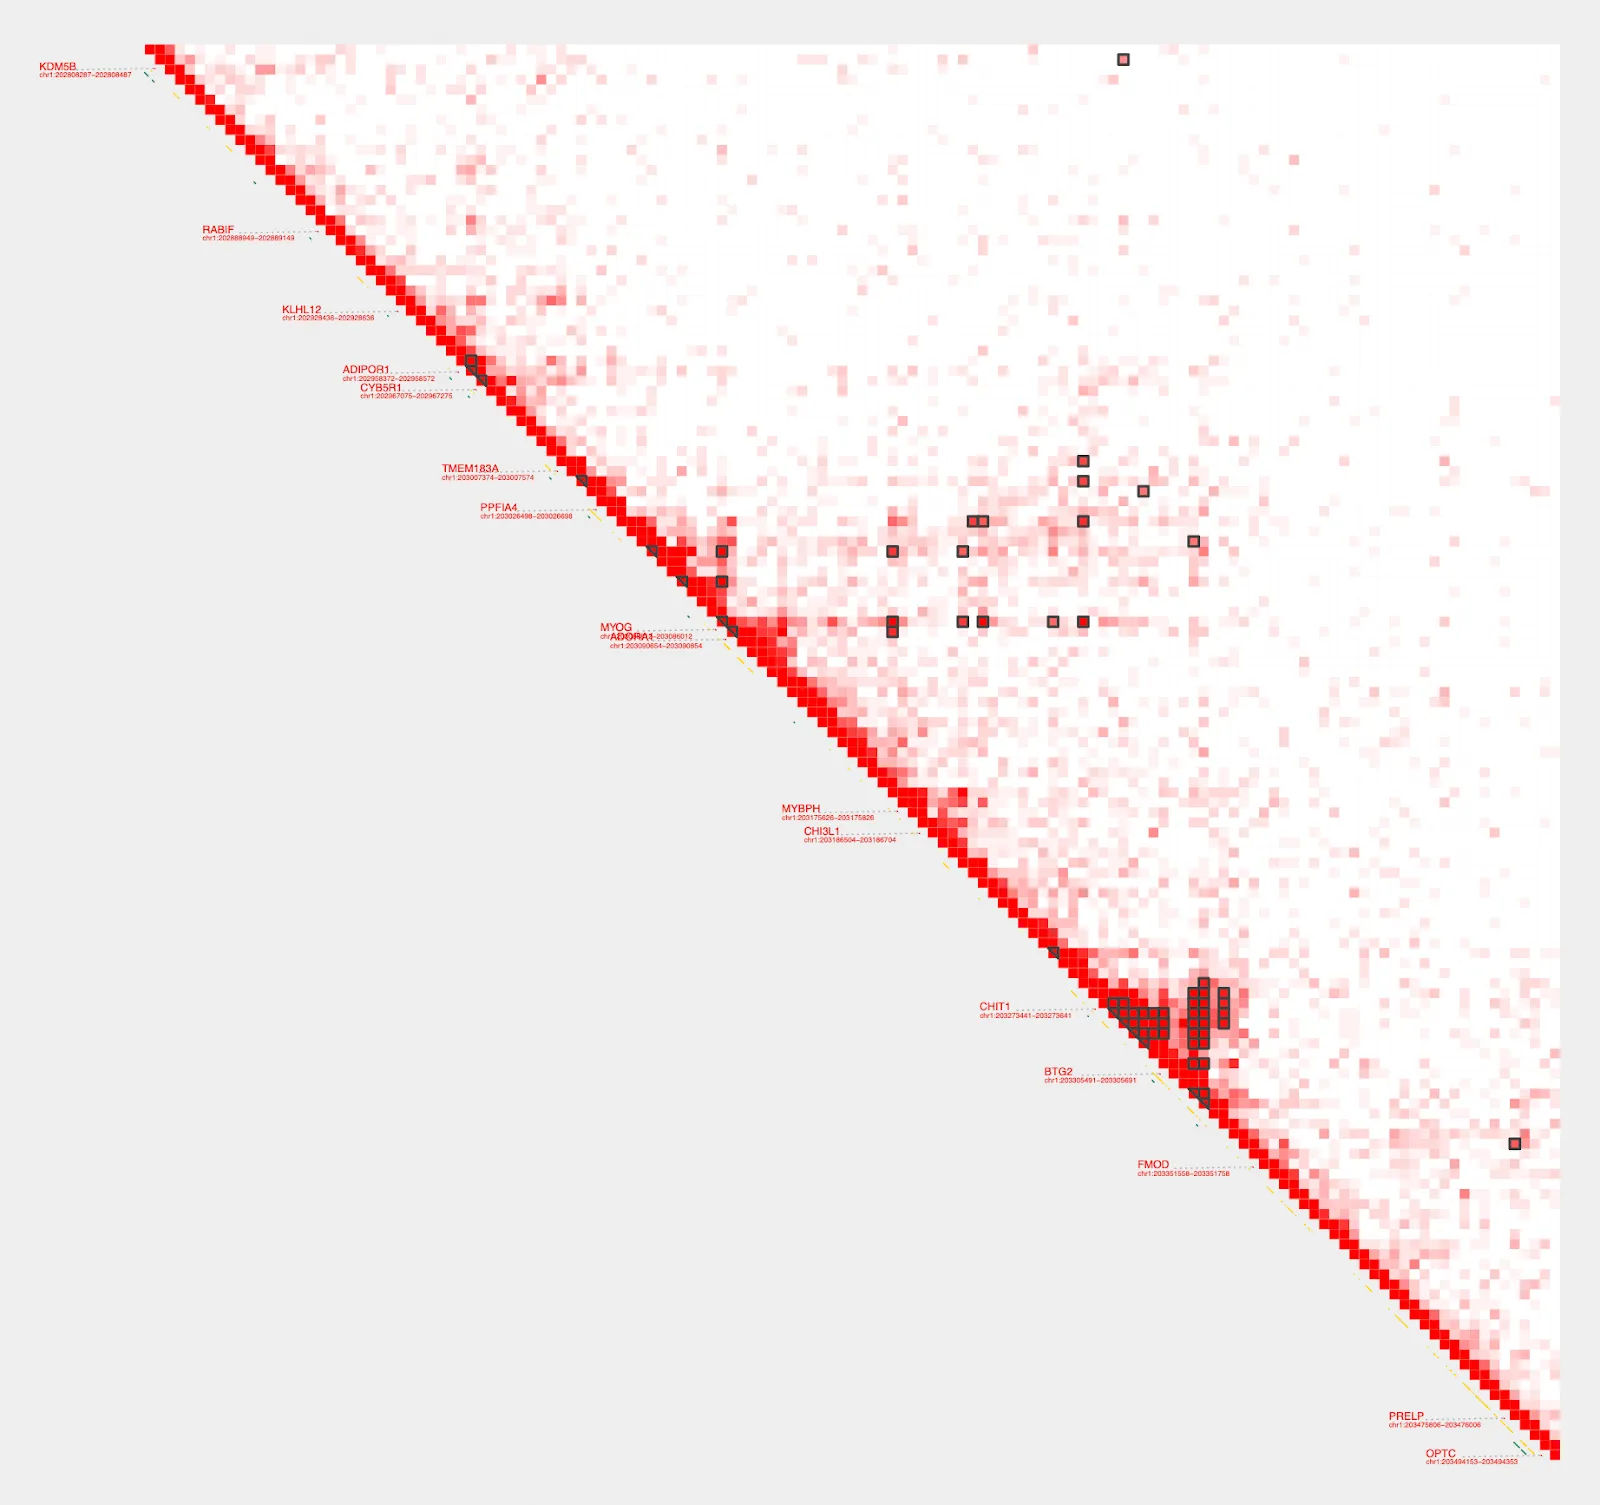
Visualize loops
get_loops
--sample_A $sample \
--genome hg38 \
--range chr1:202800000:203500000 | sort -k7n > MYOG_loops.bedpe

plot_contacts \
--sample1 $sample \
--range chr1:202800000:203500000:MYOG \
--genome hg38 \
--max_cap 1000
--output_name MYOG_loops.pdf \
--bedpe MYOG_loops.bedpe \
--bedpe_color 424242