SMARCA4
Research question
This task-based tutorial builds upon three previous tool-oriented tutorials build_bedpe, query_bedpe, and plot_contacts and also introduces an alternate solution using get_loops. Becoming familiar with these tools is recommended before diving into this tutorial. In this tutorial, we will explore two different approaches to answer the following questions:
How do the genomic interactions between H3K4me3 and H3K27ac peaks associated with the SMARCA4 gene differ between a control sample and a case sample?
To answer this question, we will use mm10 genes sourced from UCSC, coordinates for the SMARCA4 gene, and pre-existing peak files for H3K27ac and H3K4me3. First, we will use bedtools to extract the H3K4me3 peaks that are located in the gene body. Next, we will use build_bedpe to create genomic pairings between those peaks and all H3K27ac peaks within a user-defined genomic range. We’ll use query_bedpe to obtain the contact frequencies of the pairings and plot_contacts to visualize our process. We will conclude this tutorial with visualizations of the strongest and weakest interactions between control and case samples.
To list all available sample data on the Tinkerbox, simply type the following command into the terminal window:
list_samples.shLet’s assign variable names to our samples and reference files for ease
control=WT_K27ac_2i_Rep1
case=A2_K27ac_2i_Rep1
It might also be handy to have a list of mm10 genes, that’ll allow us to ask meaningful biological questions. We obtained mm10 genes from UCSC
gene_list=~/shared-files/UCSC.genes.mm10.bedObtain SMARCA4 gene coordinates
Since we now have a gene file handy, we can obtain the SMARCA4 gene coordinates from our gene list
gene=Smarca4
cat $gene_list | grep $gene > ${gene}.bed
cat ${gene}.bed
Obtain reference files from ENCODE-3
We also have some pre-cooked reference files ready; mESC H3K27ac and H3K4me3 peaks from ENCODE-3-
K4me3=~/path/to/E14Tg2a_K4me3_ENCSR212KGS_5kbins_merged_mm10.bed
K27ac=~/path/to/C57BL6_K27ac_ENCSR775OEV_5kbins_merged_mm10.bed
Extract H3K4me3 peaks
As we now have the SMARCA4 gene body, we can extract the H3K4me3 peaks that are located in the gene body, using bedtools
bedtools intersect \
   -a ${gene}.bed \
   -b $K4me3 \
   -wa -wb \
   | cut -f 5-7 > ${gene}_K4me3.bed
Construct pairs
Using build_bedpe, we can now construct genomic pairings (as a bedpe file) between our SMARCA4 K4me3 peak of interest and all H3K27ac peaks within a certain genomic distance.
build_bedpe.sh \
   -A ${gene}_K4me3.bed \
   -B $K27ac \
   --min_dist 30000 \
   --max_dist 300000 > ${gene}_K4me3-K27ac_pairings.bedpe

cat ${gene}_K4me3-K27ac_pairings.bedpe

bedpe=${gene}_K4me3-K27ac_pairings.bedpe
Obtain contact frequencies
Great! We now have all the genomic pairings we want! We can now obtain the contact frequencies of these pairings using query_bedpe and sort them in increasing order, based on control vs case values.
query_bedpe.sh \
   --sample1 $control
   --sample2 $case \
   --pair $bedpe \
   --formula sum \
   --genome mm10 \
   --norm cpm \
   --resolution 5000 \
   | sort -k9n > ${gene}_K4me3-K27ac_pairings_annotated.bedpe

cat ${gene}_K4me3-K27ac_pairings_annotated.bedpe

chr9   21605000   21620000   chr9   21715000   21775000   1.237   0.94    -0.297
chr9   21605000   21620000   chr9   21780000   21825000   0.989   0.715   -0.274
chr9   21605000   21620000   chr9   21665000   21710000   0.67    0.414   -0.257
chr9   21505000   21570000   chr9   21605000   21620000   1.661   1.429   -0.232
chr9   21575000   21580000   chr9   21605000   21620000   0.177   0.038   -0.139
chr9   21605000   21620000   chr9   21830000   21880000   0.389   0.301   -0.088
chr9   21365000   21375000   chr9   21605000   21620000   0.212   0.15    -0.062
chr9   21475000   21480000   chr9   21605000   21620000   0        0       0
chr9   21605000   21620000   chr9   21885000   21890000   0        0       0
chr9   21605000   21620000   chr9   21645000   21660000   0.141    0.15    0.009
chr9   21380000   21385000   chr9   21605000   21620000   0.035    0.075   0.04
chr9   21490000   21500000   chr9   21605000   21620000   0.035    0.075   0.04
chr9   21605000   21620000   chr9   21895000   21965000   0.565    0.715   0.15
chr9   21395000   21470000   chr9   21605000   21620000   0.53     0.752   0.222
Visualize pairs
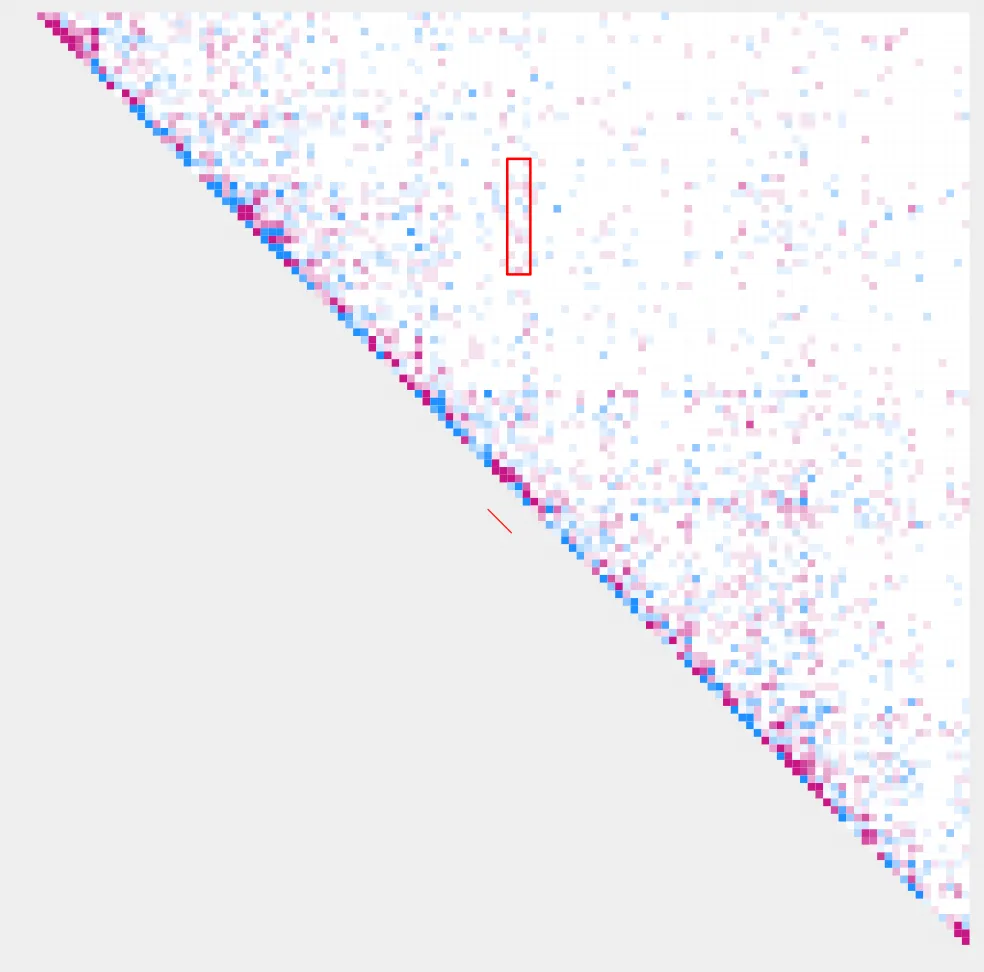
Let’s visualize our results using plot_contacts
plot_contacts.sh
   --sample1 $control \
   --range chr9:21300000:21900000:${gene} \
   --genome mm10 \
   --output_name ${gene}.pdf \
   --norm cpm \
   --resolution 5000 \
   --max_cap 0.2 \
   --bedpe $bedpe \
   --bedpe_color 000000 \
   --annotations_custom ${gene}_K4me3.bed \
   --annotations_custom_color FF0000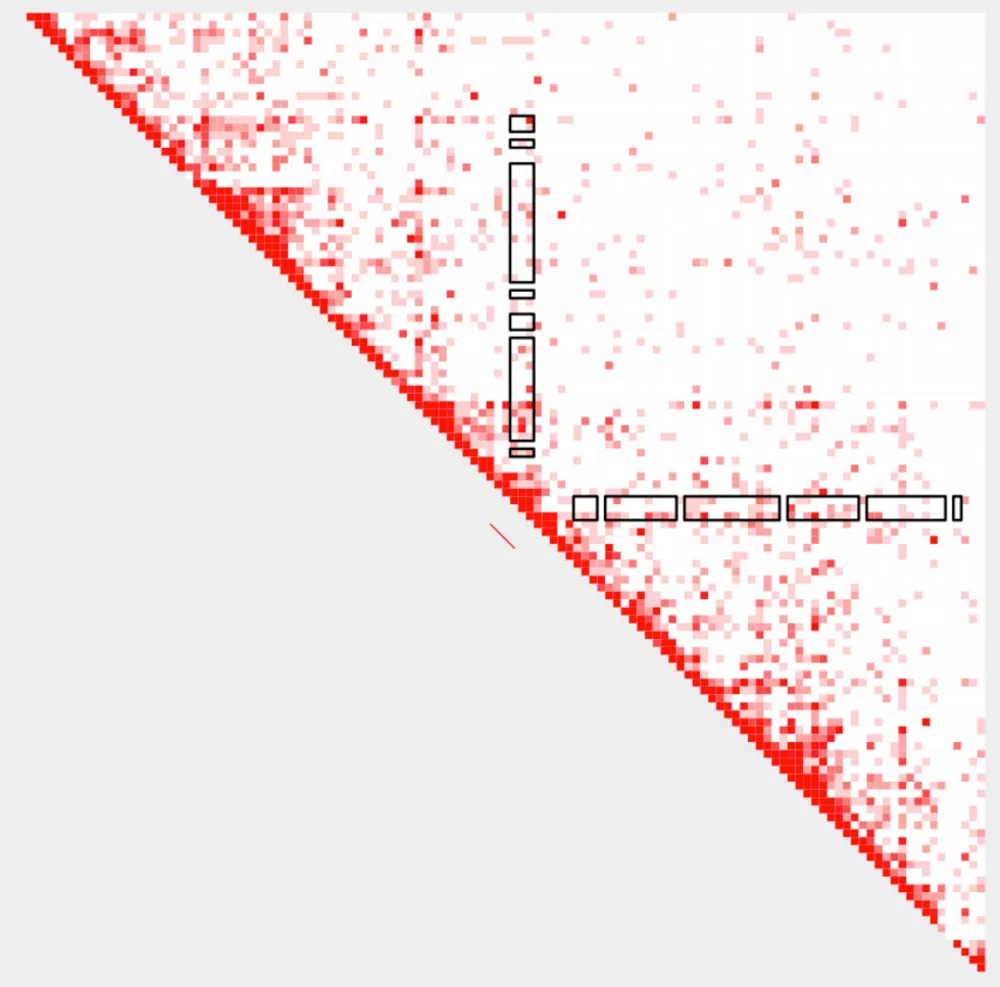
Sort pairs
Which K4me3-K27ac pairs show maximum and minimum changes in contacts across the two samples? Let’s use commands to extract the top and bottom pairings from this list. Next, we will use the --bedpe option of plot_contacts to view the high and low pairs within the contact matrix.
head -n 1 \
${gene}_K4me3-K27ac_pairings_annotated.bedpe \
> low_${gene}_K4me3-K27ac_pairings_annotated.bedpe

tail -n 1 \
${gene}_K4me3-K27ac_pairings_annotated.bedpe \
> high_${gene}_K4me3-K27ac_pairings_annotated.bedpe
Visualize low contact value pairs
plot_contacts.sh \
   --sample1 $control \
   --sample2 $case \
   --range chr9:21300000:21900000:${gene} \
   --genome mm10 \
   --output_name ${gene}_1.pdf \
   --norm cpm \
   --resolution 5000 \
   --max_cap 0.2 \
   --bedpe low_${gene}_K4me3-K27ac_pairings_annotated.bedpe \
   --bedpe_color 0000FF \
   --annotations_custom ${gene}_K4me3.bed \
   --annotations_custom_color FF0000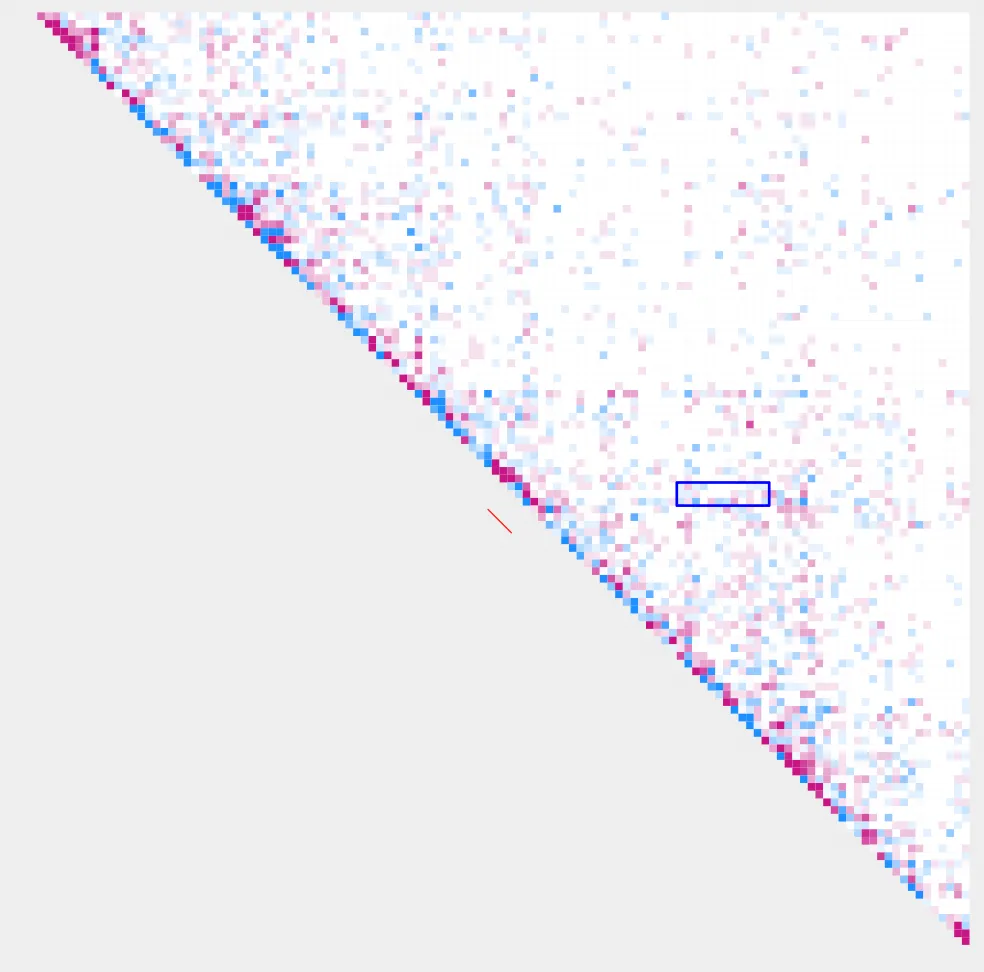
Visualize high contact value pairs
plot_contacts.sh \
   --sample1 $control
   --sample2 $case
   --range chr9:21300000:21900000:${gene} \
   --genome mm10 \
   --output_name ${gene}_2.pdf \
   --norm cpm \
   --resolution 5000 \
   --max_cap 0.2 \
   --bedpe high_${gene}_K4me3-K27ac_pairings_annotated.bedpe \
   --bedpe_color FF0000 \
   --annotations_custom ${gene}_K4me3.bed \
   --annotations_custom_color FF0000