Concepts
For many AQuA tool users, query_bedpe serves as the go-to secondary tool in the pipeline when addressing questions related to genomic interactions. After you’ve obtained a bedpe file with build_bedpe, query_bedpe is the next logical step to focus on the interactions that matter most for your research.
Visualize bedpe
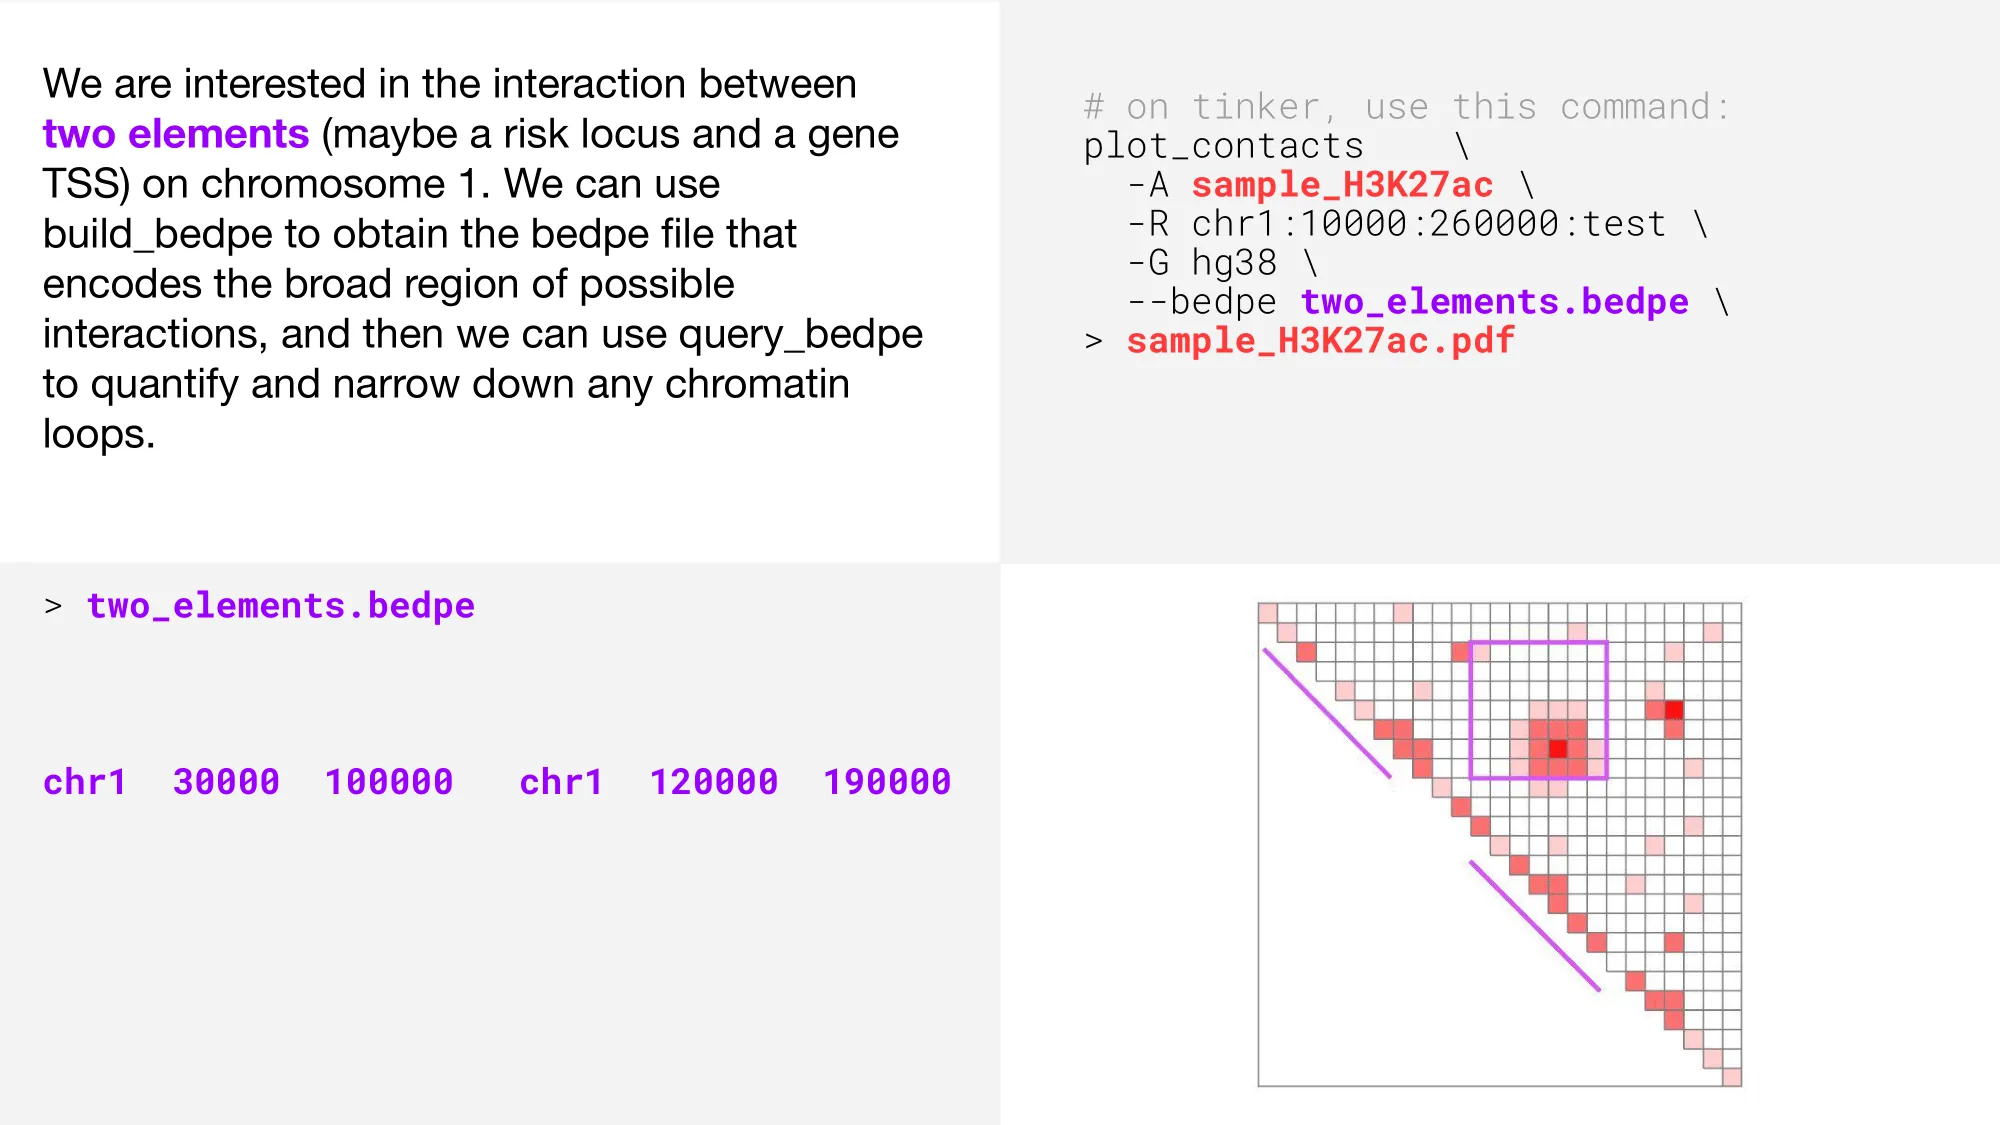
Let’s explore some key features and settings that make query_bedpe a versatile tool for 3G genomics research. We’ll start by visualizing a bedpe using the --bedpe option with plot_contacts.
Report contact values
The purple square shows the bedpe region, and the two diagonal purple lines show the bedpe feet. Now, let’s use query_bedpe to determine contact values within our bedpe. The contact value will be printed to standard out in the 7th column.
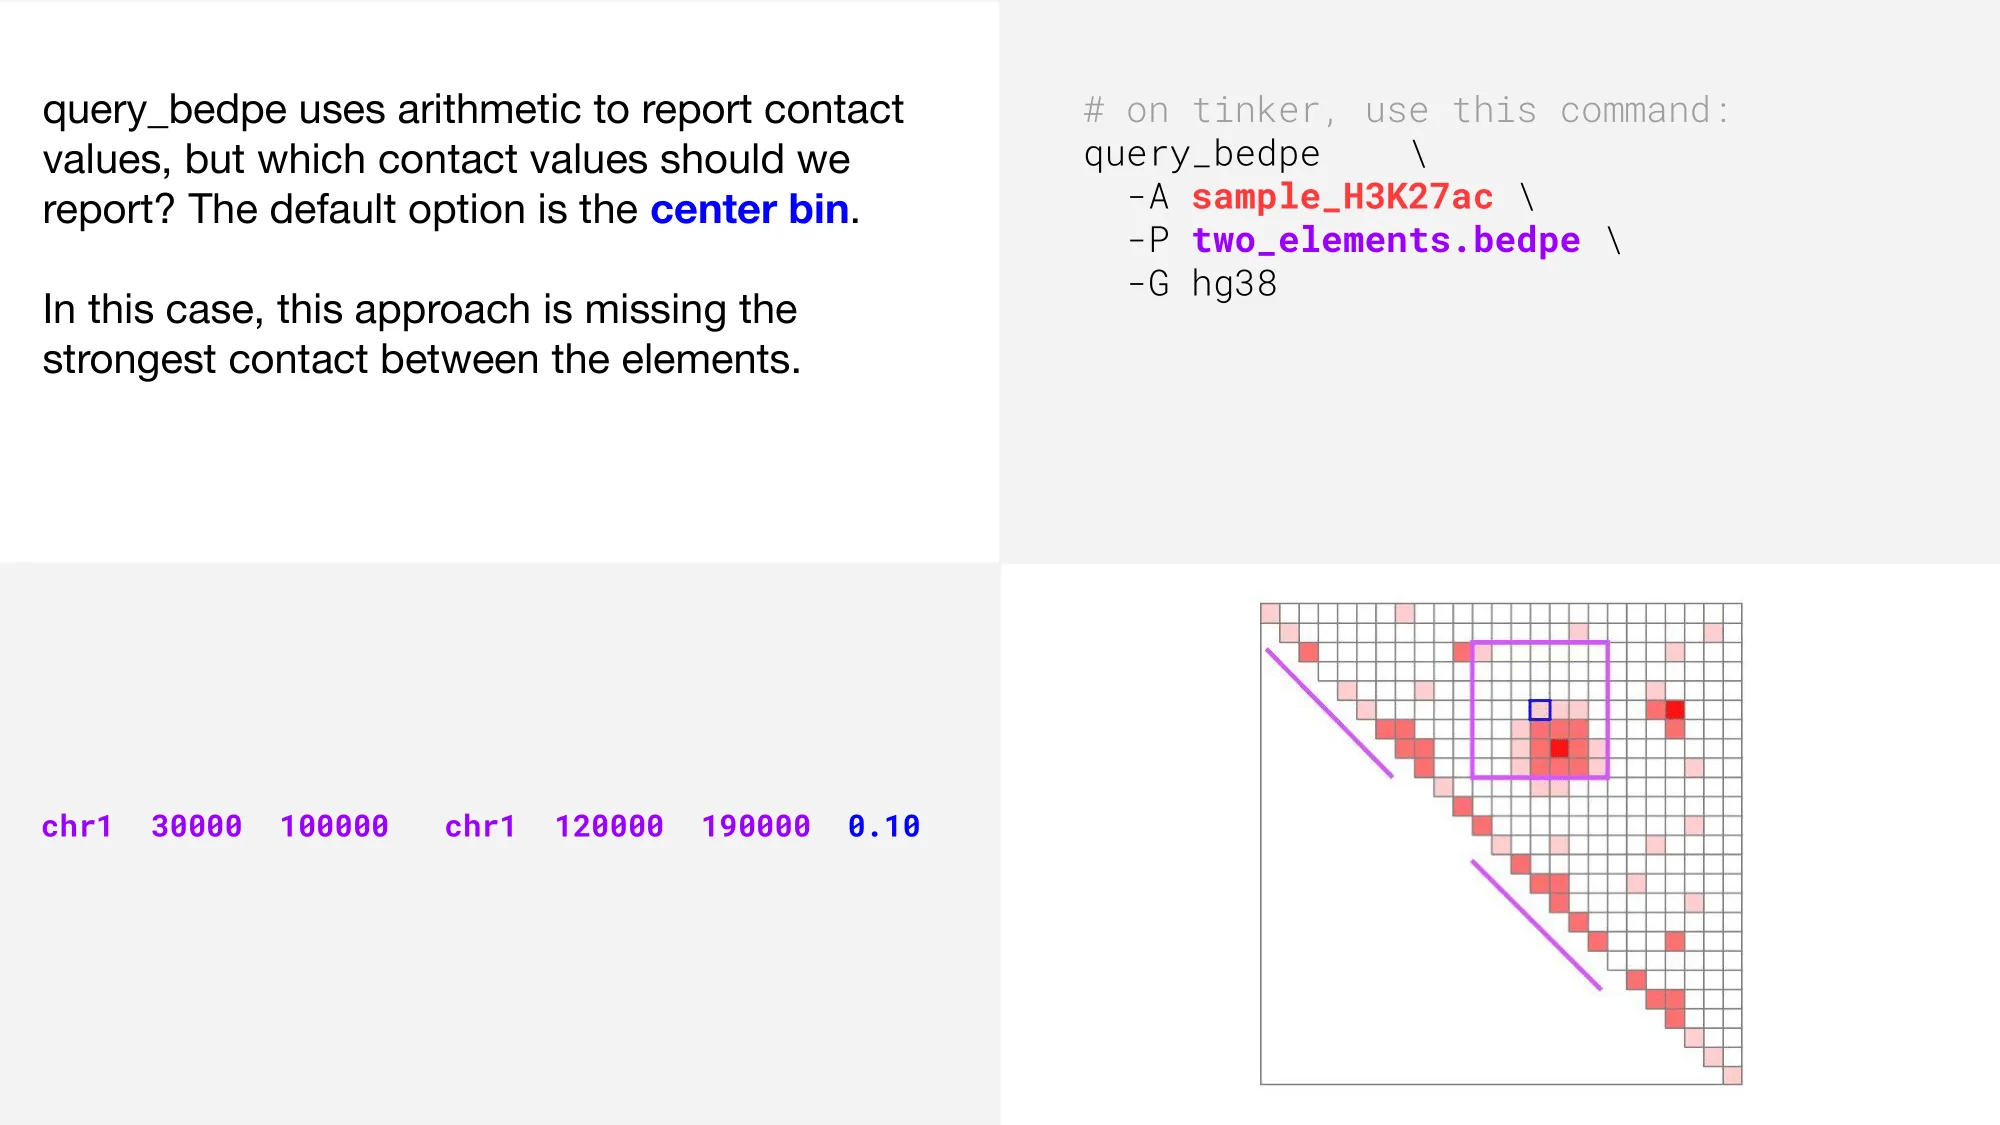
In the above plot, we can see that the strongest interaction (represented by the darkest color of red), is not the value that is reported when we use the default query_bedpe settings.
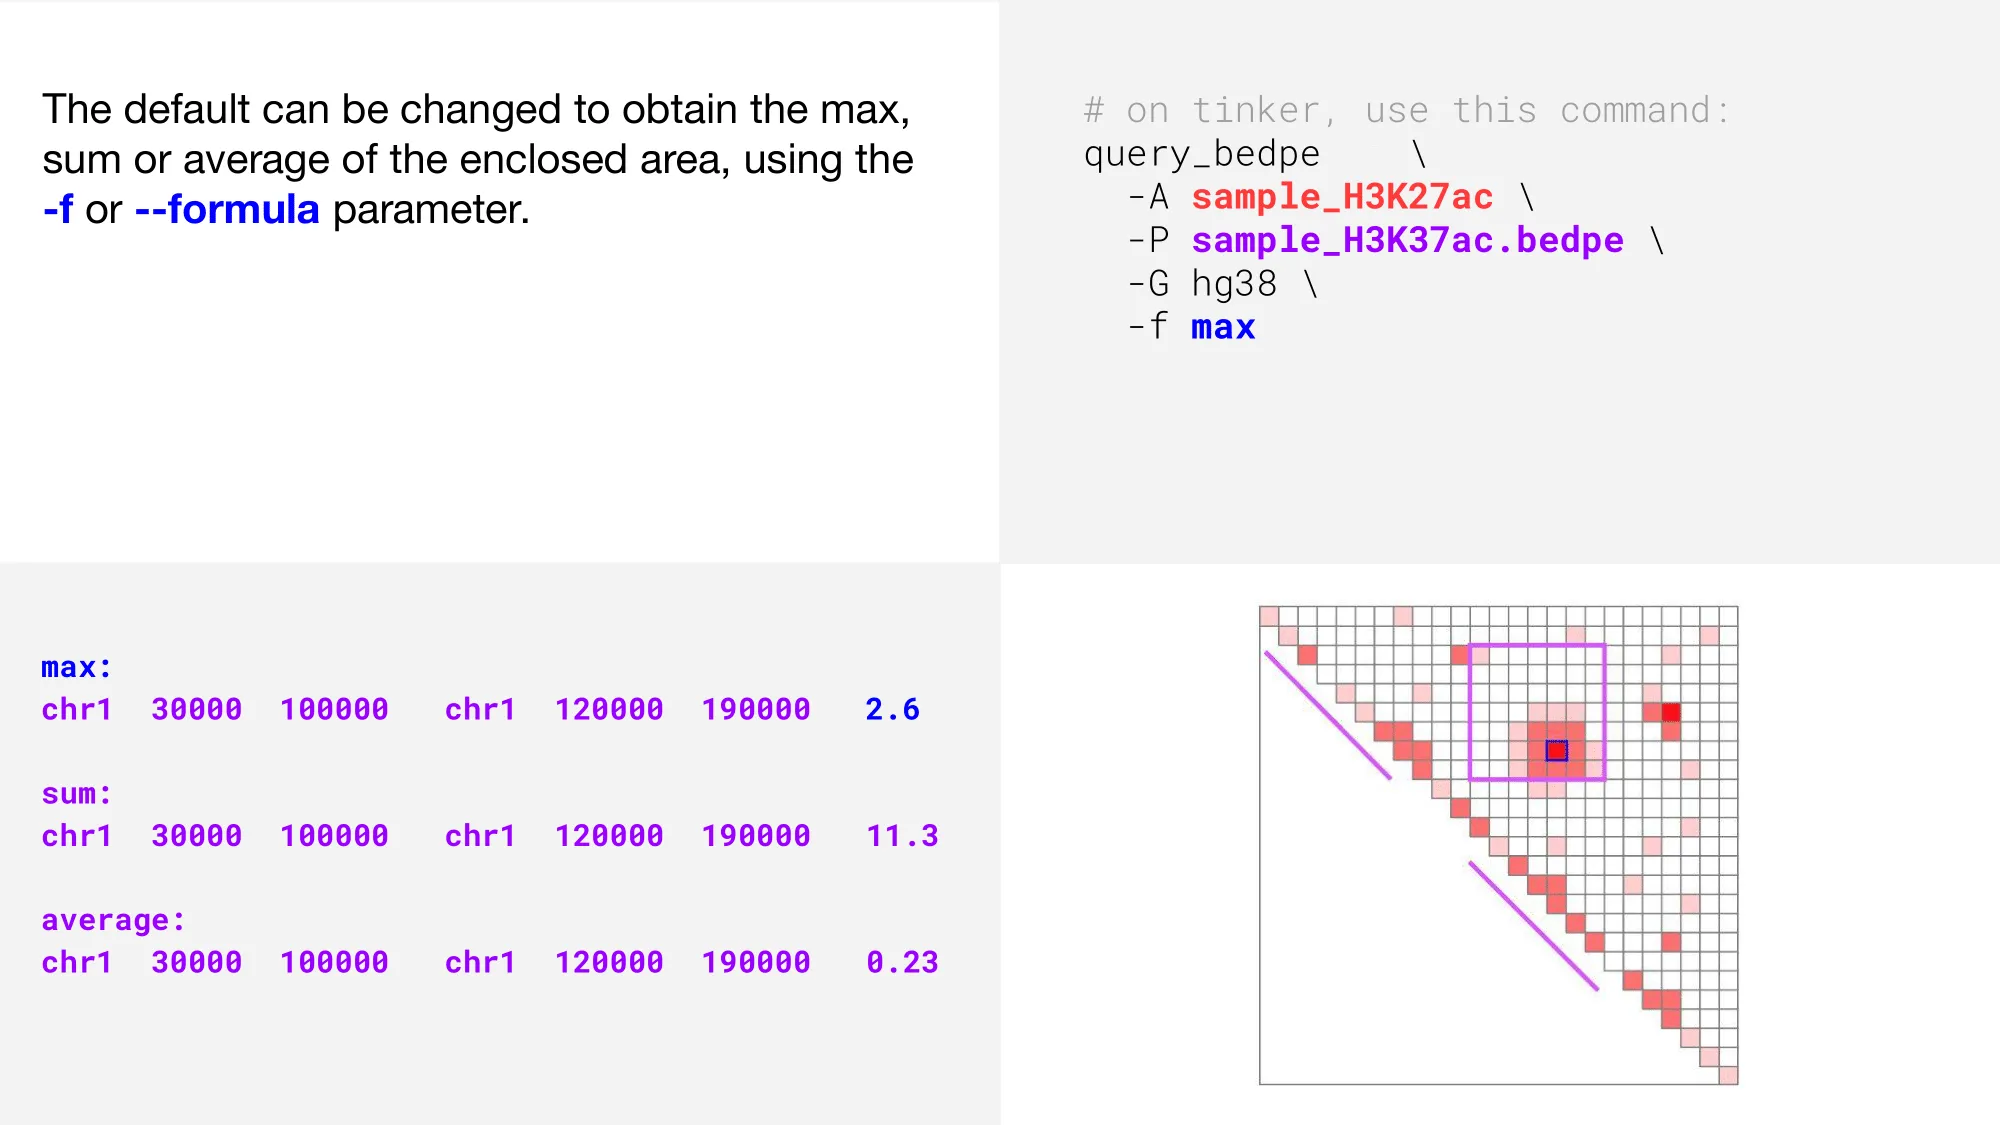
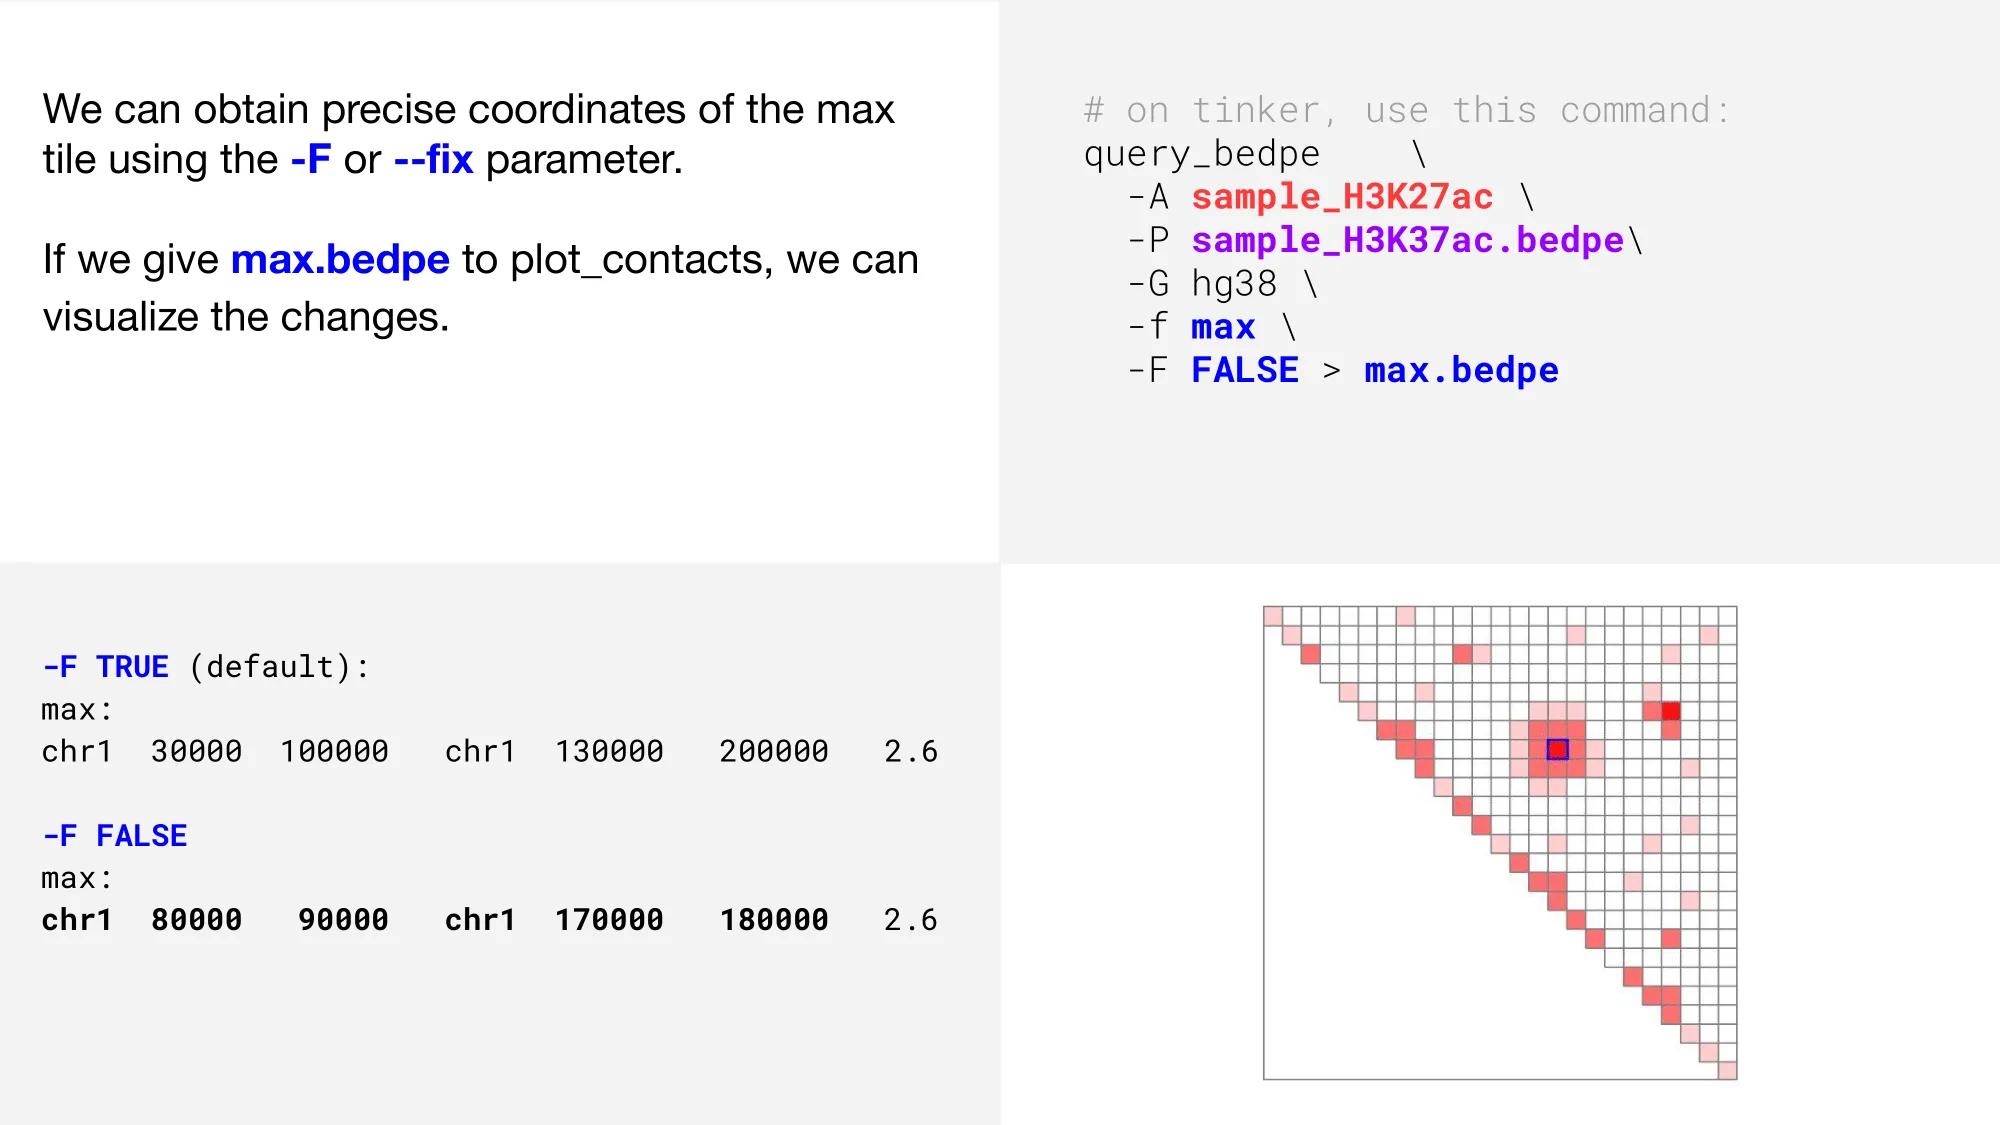
That’s better! Now, how do we get those coordinates?
Update coordinates
There are many additional, optional parameters that can be employed to narrow, expand, and refine your search. shrink_wrap, split, and expand are three such options.
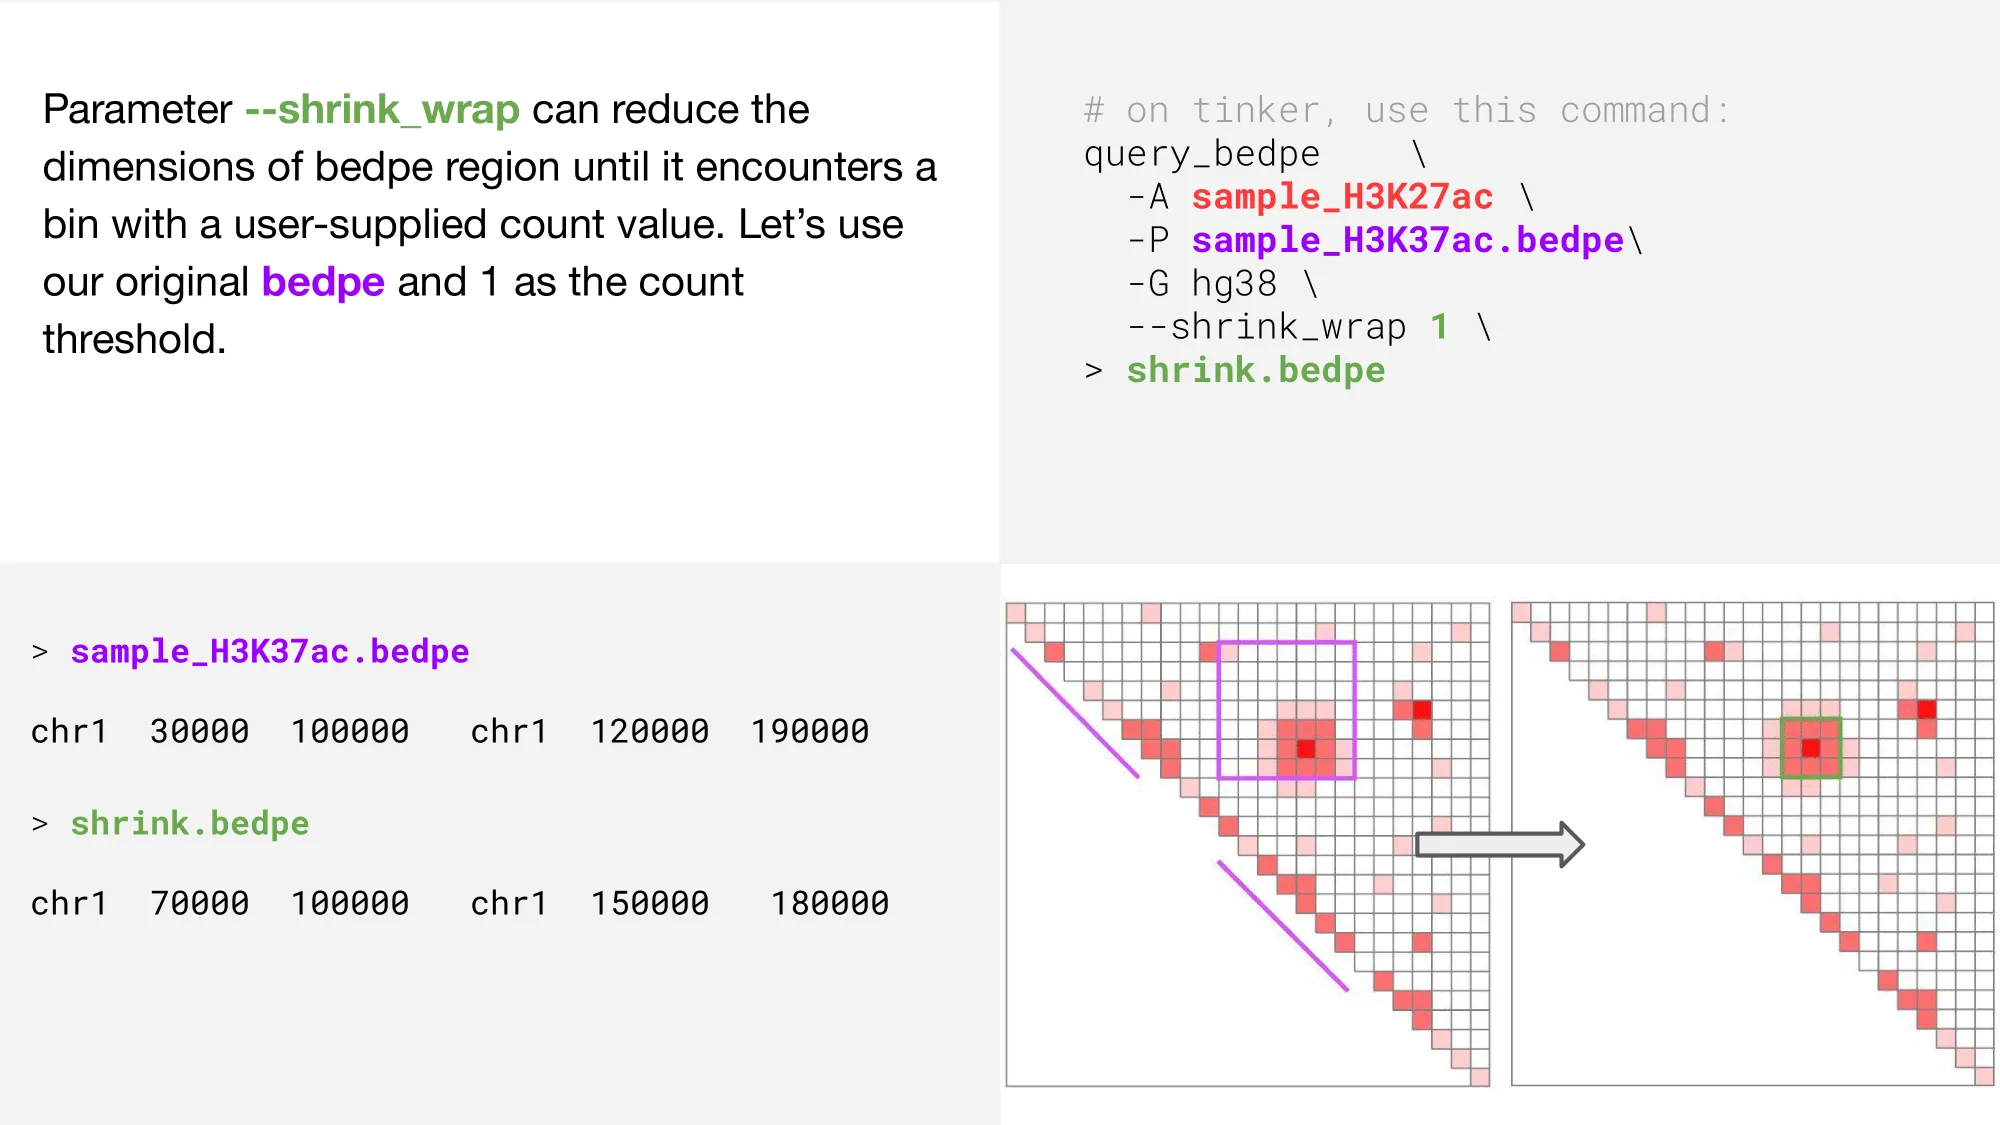
shrink_wrap
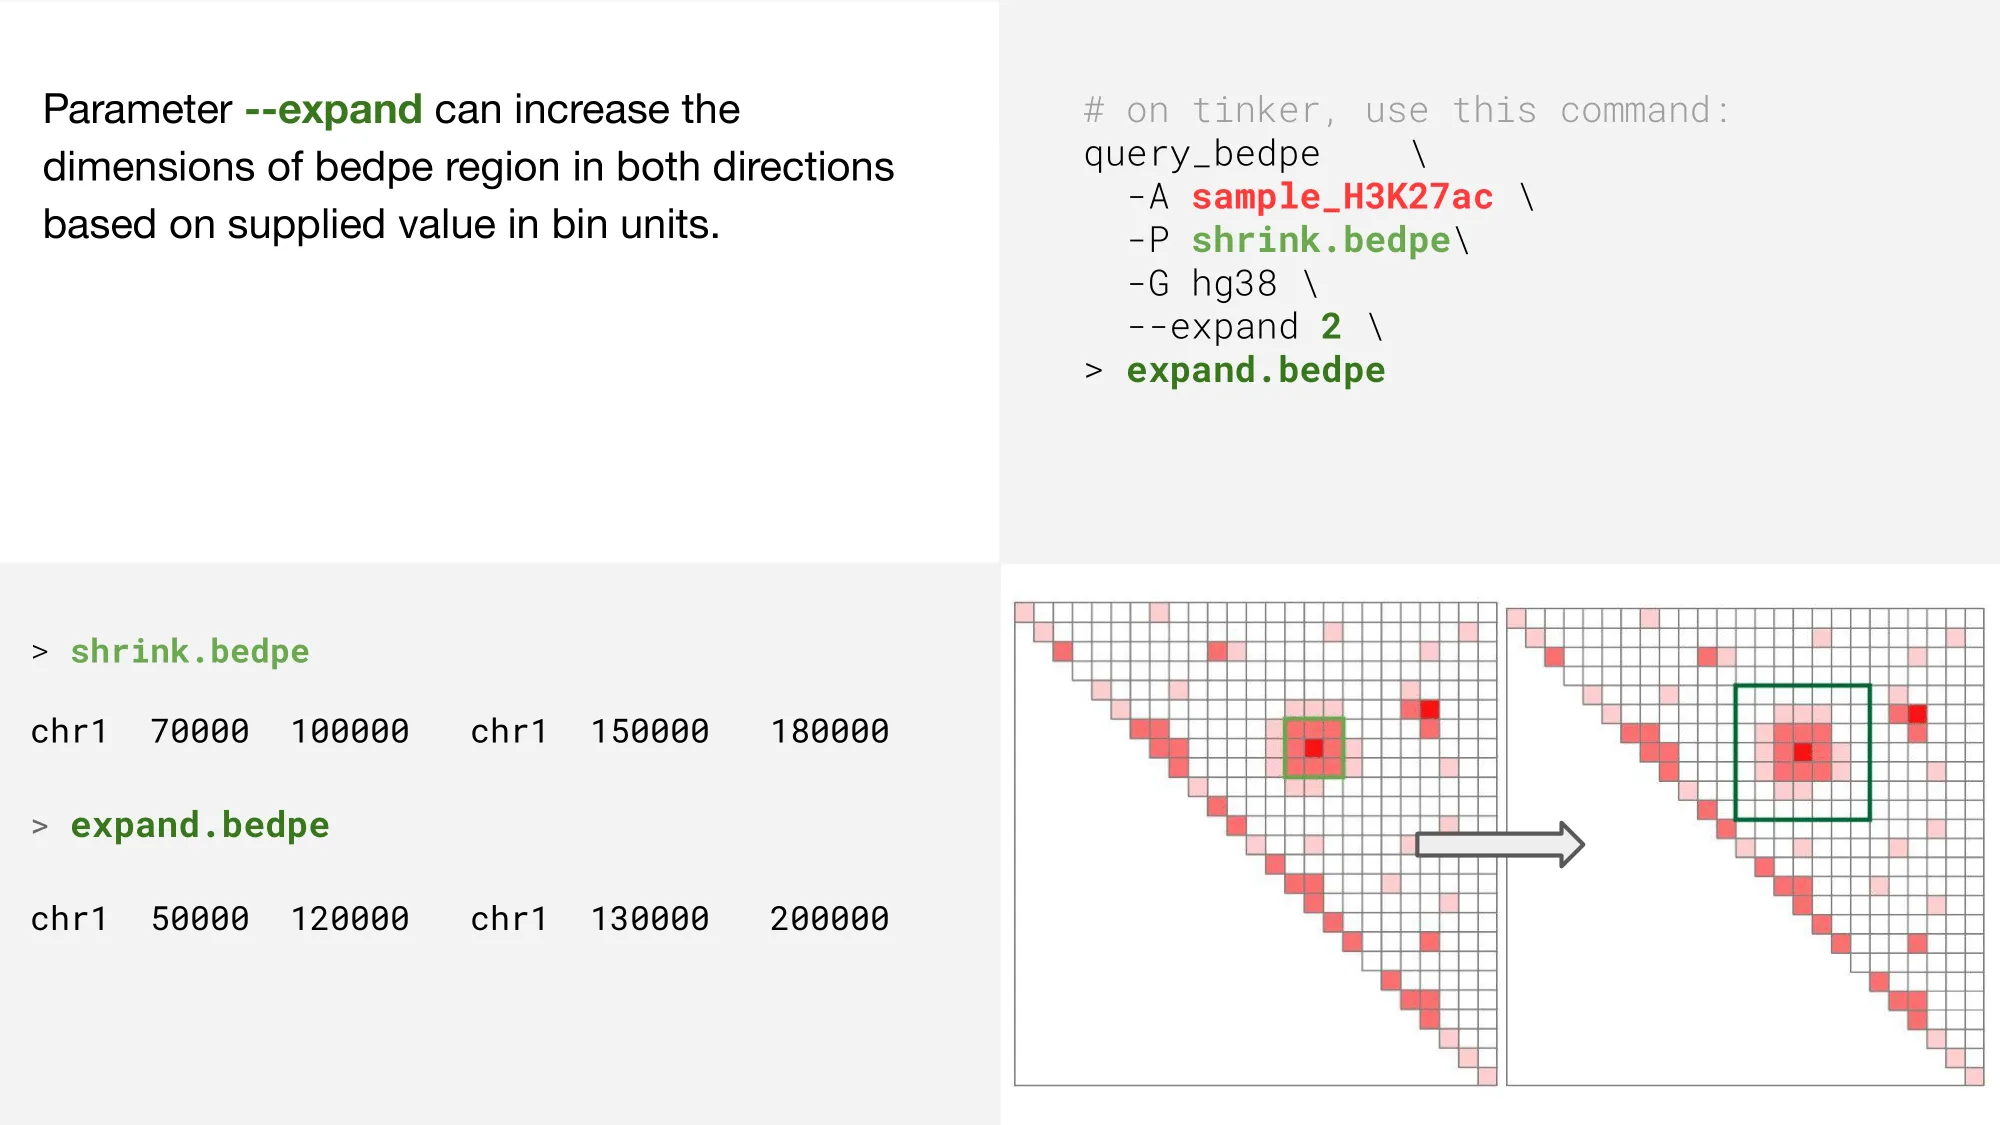
expand
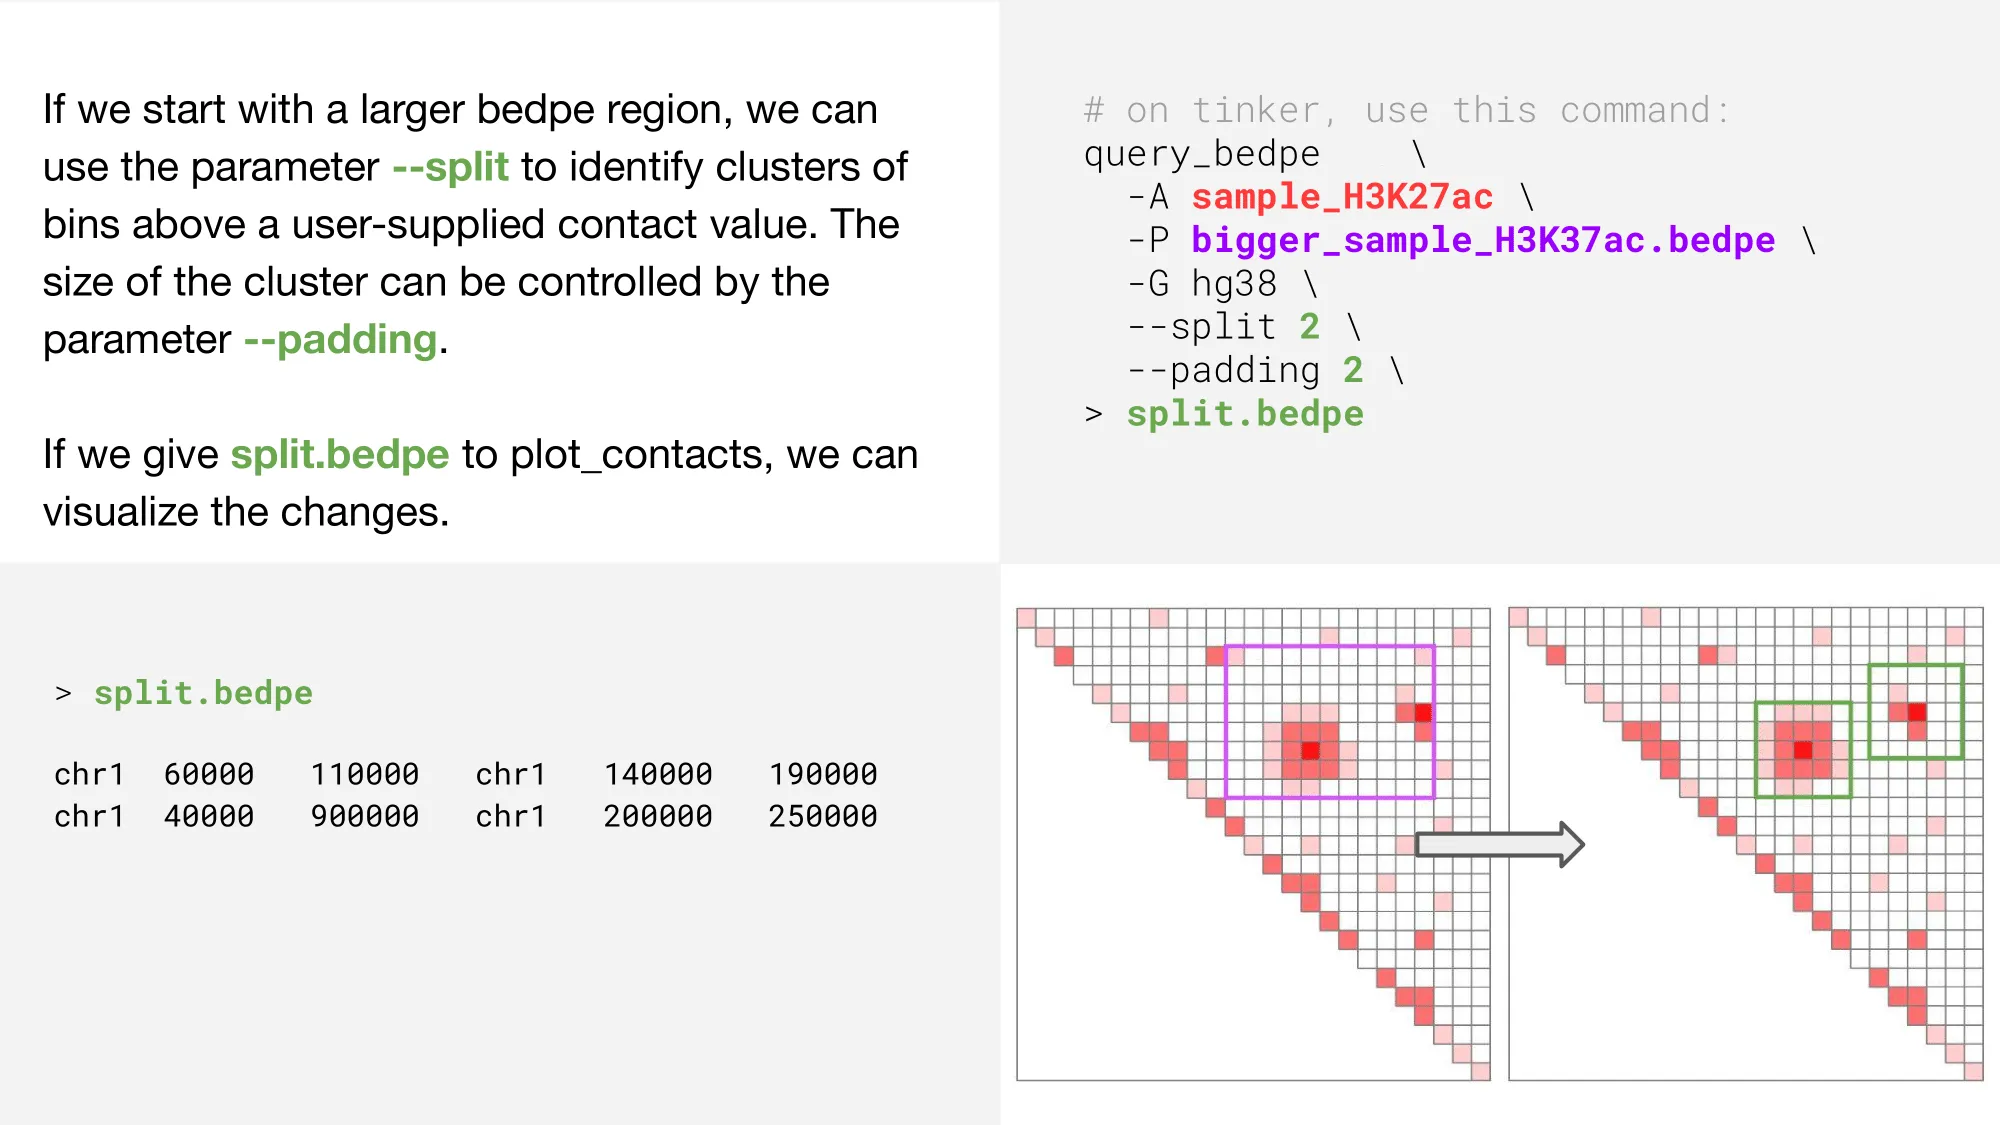
split
For a full list of parameters, type query_bedpe -h into your tinkerbox for the help message, or view the tool tutorial here. Using plot_contacts to visualize your process is extremely helpful. Please click here for the plot_contacts tool tutorial. To see examples of query_bedpe used in pipelines addressing realistic 3D genomics research questions, check out the SOX8, FOXO1/MYOG, or SMARCA4 tutorials.