Examples
This is a tool-oriented primer designed to guide you through the functionalities of query_bedpe. From your tinker box, type query_bedpe -h into the command window and press enter to view the help message.
Help message
query_bedpe -h

Query and annotate a bedpe file with AQuA normalized contact values

-P|--pair            : Full path to the bedpe (pairs) file you want to annotate, without headers!
-A|--sample1         : Name of the sample you want to use as it appears on the Tinkerbox
-G|--genome          : The genome build the sample(s) has been processed using. Strictly hg19 or hg38
[ -Q|--norm        ] : Which normalization to use. Strictly 'none', 'cpm' or 'aqua' in lower case. Non-spike-in samples default to cpm. Spike-in samples default to aqua.
[ -B|--sample2     ] : The name of the second sample. If triggered, calculates the delta contact values for that pair. Useful in case vs control
[ -R|--resolution  ] : Resolution of sample in basepairs, using which the contact values should be calculated. Default 5000. Accepted resolutions- 1000,5000,10000,25000,50000,100000,250000,500000,1000000,2500000
[ -f|--formula     ] : Arithmetic to use to report contact calues. Options- center, max, average, sum. Default = center
[ -F|--fix         ] : If FALSE, reports new coordinates based on arithmetic center or max. Default = TRUE
[    --shrink_wrap ] : Squeezes a 2D bedpe interval until supplied value is reached. Default = FALSE
[    --split       ] : Splits a 2D bedpe interval into multiple sub-intervals greater than supplied value. Default = FALSE
[    --padding     ] : Joins sub-intervals in 2D space reported by --split, based on supplied value in bin units. Default = 2
[    --expand      ] : Expands 1D bedpe feet in both directions based on supplied value(in bin units). Default = 0
[ -I|--inherent    ] : If TRUE, hic values transformed to inherent units. For one-sample tests only. Default = FALSE
[ -m|--preserve_meta]: If TRUE, bedpe metadata columns will be preserved. Default = FALSE
[ -h|--help        ] : Help message. Primer can be found at [https://rb.gy/zyfjxc](https://rb.gy/zyfjxc)
Viewing loops
Let’s tinker with this tool using provided sample data in your tinker box.
The sample data comes from H3K27ac HiChIP experiments performed in a childhood rhabdomyosarcoma cell line (Gryder et al., 2019), treated with DMSO and HDAC inhibitor Entinostat.
sample1=RH4_DMSO
sample2=RH4_HDACi
Loops in 3D genomics are two stretches of DNA with high contact frequency. We first built query_bedpe to quickly access the conformation matrix and obtain interaction counts between any two regions. Over time, we’ve enhanced its abilities to handle imprecise loop coordinates.
For this primer we’re looking at two example interacting regions, each 55kb in size, separated by a distance of 120kb. These two regions are stored in a bedpe file.
bedpe=$/path/to/sample.bedpe

cat $bedpe
chr16     875000     930000      chr16     1050000     1105000
Before we continue with query_bedpe, let’s first visualize this hypothetical loop using another tool in the AQuA Tools suite, plot_contacts. Visualizations will be helpful understanding the outputs we get from query_bedpe. To accomplish this, we will use the RH4_DMSO_K27ac sample at 5kb resolution.
annotation=$tutorial_data_path/sample.bed

cat $annotation
chr16        875000       930000
chr16       1050000      1105000

range=chr16:790000:1260000:test
resolution=5000
genome=hg38

plot_contacts \
-A $sample1 \
-R $range \
-G $genome \
-O AL_1.pdf \
-Q aqua \
--max_cap 1 \
--annotations_default FALSE \
--annotations_custom $annotation \
--annotations_custom_color c000ff \
--bedpe $bedpe \
--bedpe_color c000ff
This is our loop!
Reporting bin values with —formula
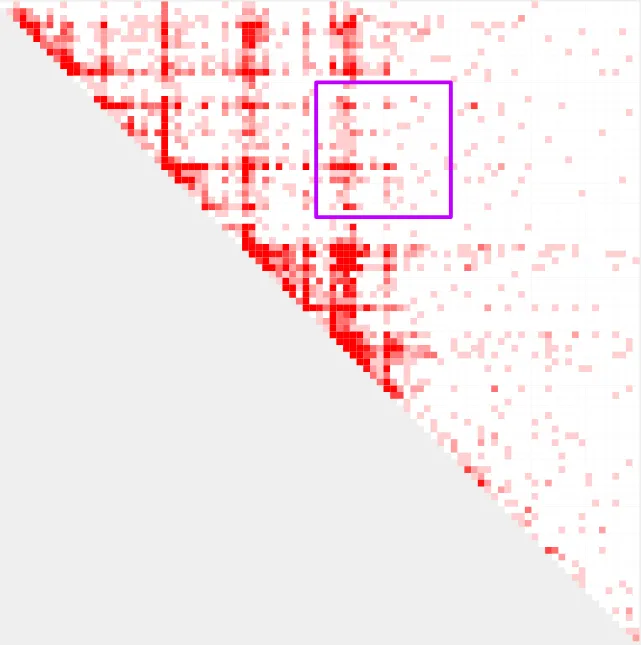
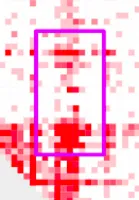
Now that we have a visual understanding of the loop we are working with, we can use query_bedpe to ask questions about this loop. We are likely interested in the contact values (red bins) within this region, but which contact value from the loop (purple square) should we report? The default option is the center bin.

However, in this case, the default (center) bin is not the best choice. For single sample analyses, query_bedpe will return coordinates in the first 6 columns and contact values in the 7th column. As you can see below, query_bedpe reports a 0 value for this bin.
query_bedpe \
- A $sample1 \
- P $bedpe \
- G $genome

chr16   875000    930000    chr16   1050000    1105000    0
The default can be changed to obtain the max, sum or average of the enclosed 2D area, using the -f or --formula parameter.
query_bedpe \
  -A $sample1 \
  -P $bedpe \
  -G $genome \
  --formula max

chr16     875000     930000    chr16       1050000    1105000      2.42
query_bedpe \
-A $sample1 \
-P $bedpe \
-G $genome \
--formula sum
chr16 875000 930000 chr16 1050000 1105000 11.54query_bedpe \
-A $sample1 \
-P $bedpe \
-G $genome \
--formula average
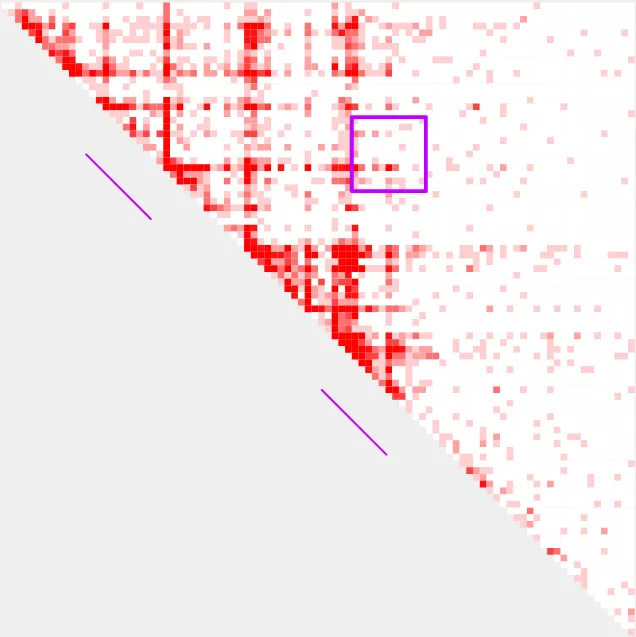
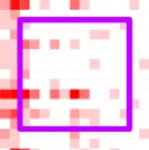
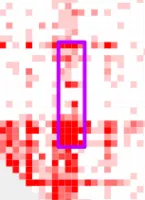
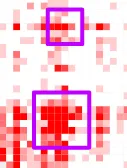
chr16 875000 930000 chr16 1050000 1105000 0.095This is the area for sum and average --formula parameters
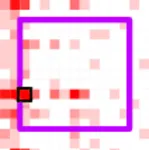
This is the area for max --formula parameter
Normalization methods
We can also change default behavior of the tool and report counts per million contact values, instead of the default AQuA normalized values, using the -Q or
--norm parameter.
query_bedpe \
  -A $sample1 \
  -P $bedpe \
  -G $genome \
  --formula max \
  --norm cpm

chr16     875000     930000     chr16     1050000     1105000   0.436
query_bedpe \
-A $sample1 \
-P $bedpe \
-G $genome \
--formula sum \
--norm cpm
chr16 875000 930000 chr16 1050000 1105000 2.079query_bedpe \
-A $sample1 \
-P $bedpe \
-G $genome \
--formula average \
--norm cpm
chr16 875000 930000 chr16 1050000 1105000 0.017Fixed or updating coordinates based on —formula
The above example reports back the same bedpe coordinates you supplied. However, the center and max bins (contained within the supplied 2D area) will have different (smaller) 2D genomic areas than the ones supplied. Using the -F or --fix parameter, we can instruct query_bedpe to either keep the coordinates fixed (default; —fix TRUE), or to return updated bedpe coordinates along with the contact value (—fix FALSE). This assists in obtaining precise coordinates from fuzzy intervals. Let’s compare output when --fix is TRUE and FALSE.
query_bedpe \
  -A $sample1 \
  -P $bedpe \
  -G $genome \
  --formula center \
  --fix FALSE

chr16     900000     905000    chr16     1075000    1080000    0

# --fix TRUE
# chr16    875000    930000    chr16     1050000    1105000    0
query_bedpe \
-A $sample1 \
-P $bedpe \
-G $genome \
--formula max \
--fix FALSE
chr16 910000 915000 chr16 1050000 1055000 0.436
# --fix TRUE
#chr16 875000 930000 chr16 1050000 1105000 0.436query_bedpe \
-A $sample1 \
-P $bedpe \
-G $genome \
--formula sum \
--fix FALSE
chr16 875000 930000 chr16 1050000 1105000 2.079
# --fix TRUE
# chr16 875000 930000 chr16 1050000 1105000 2.079query_bedpe \
-A $sample1 \
-P $bedpe \
-G $genome \
--formula average \
--fix FALSE
chr16 875000 930000 chr16 1050000 1105000 0.017
# --fix TRUE
#chr16 875000 930000 chr16 1050000 1105000 0.017You can see how the coordinates have changed when using --fix FALSE for center and max bins.
Two sample query & delta contact values
We can also use query_bedpe to obtain contact values of bedpe regions of two samples at the same time.
query_bedpe \
-A $sample1 \
-P $bedpe \
-G $genome \
-B $sample2

chr16   875000    930000    chr16   1050000    1105000    0    0.379   0.379
We now have two new columns! The first contact value is for sample1 (-A), the second for sample2 (-B), and the third column is the delta contact value (sample2 - sample1). This can be very useful in case-control analyses.
query_bedpe \
-A $sample1 \
-P $bedpe \
-G $genome \
-B $sample2 \
--formula max

chr16   875000    930000    chr16   1050000    1105000   2.42   2.653   0.233
What happens if we supply --fix FALSE to get the precise max bin coordinates?
query_bedpe \
- A $sample1 \
- P $bedpe \
- G $genome \
- B $sample2 \
- -formula max \
- -fix FALSE

chr16    875000    930000   chr16   1050000   1100000   2.42   2.653   0.233
We do not get altered coordinates, since we’re dealing with two samples at the same time! Parameter --fix FALSE only works with one sample analysis.
Shrink-wrap
Time to try out some more powerful query_bedpe functionalities, all designed to find better signal from fuzzy intervals! Let’s look at a larger region.
bedpe=sample_bedpe_2.bedpe

cat $bedpe
chr16    895000    990000     chr16    1020000     1070000

annotation=sample_bed_2.bed

cat $annotation
chr16     895000     990000
chr16    1020000    1070000
plot_contacts \
-A $sample1 \
-R $range \
-G $genome \
-O AL_2.pdf \
-Q aqua \
--max_cap 1 \
--annotations_default FALSE \
--annotations_custom $annotation \
--annotations_custom_color c000ff \
--bedpe $bedpe \
--bedpe_color c000ff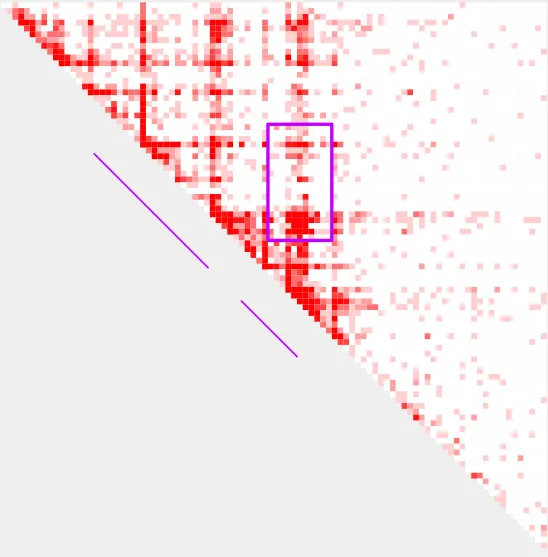
Parameter --shrink_wrap can reduce the dimensions of a 2D bedpe region until it encounters a bin with a user-supplied count value. Here, we will use 10 as the count value. We will also use
--formula sum to show the decrease following --shrink_wrap, since the 2D area is shrinking.
query_bedpe \
- A $sample1 \
- P $bedpe \
- G $genome \
- -formula sum

chr16    895000     990000     chr16    1020000     1070000     62.744

query_bedpe \
- A $sample1 \
- P $bedpe \
- G $genome \
- -formula sum \
- -shrink_wrap 10 > shrink.bedpe

cat shrink.bedpe

chr16   910000      990000     chr16    1040000     1060000    46.173
Let’s visually inspect the effect of shrink_wrap with plot_contacts
plot_contacts \
-A $sample1 \
-R $range \
-G $genome \
-O AL_3.pdf \
-Q aqua \
--max_cap 2 \
--annotations_default FALSE \
--bedpe shrink.bedpe \
--bedpe_color c000ff
before shrink_wrap
after shrink_wrap
Split
Parameter --split can identify clusters of bins above a user-supplied contact value. The size of the cluster can be controlled by the parameter --padding.
query_bedpe \
- A $sample1 \
- P $bedpe \
- G $genome \
- -split 8 --padding 2 > split.bedpe

cat split.bedpe

chr16      900000      925000     chr16      1040000     1065000    2.42
chr16      960000     1000000     chr16      1030000     1070000    3.91
plot_contacts \
-A $sample1 \
-R $range \
-G $genome \
-O AL_4.pdf \
-Q aqua \
--max_cap 1 \
--annotations_default FALSE \
--bedpe split.bedpe \
--bedpe_color c000ffbefore split
after split
Expand
Given a supplied 2D bedpe area, parameter --expand can, as the name suggests, expand the 2D area in units of the resolution. We will use --expand with --fix FALSE to see the expanded coordinates in our output. Let’s use our original loop example again.
bedpe=sample_bedpe.bedpe
cat $bedpe

chr16      875000      930000      chr16       1050000     1105000

query_bedpe \
- A $sample1 \
- P $bedpe \
- G $genome \
- -formula sum

chr16      875000      930000      chr16       1050000     1105000     11.543

query_bedpe \
- A $sample1 \
- P $bedpe \
- G $genome \
- -formula sum \
- -fix FALSE \
- -expand 5

chr16      850000      955000      chr16       1025000     1130000     33.699
before expand
after expand